Why the West Rules--For Now (29 page)
Read Why the West Rules--For Now Online
Authors: Ian Morris
Tags: #History, #Modern, #General, #Business & Economics, #International, #Economics

The West’s epitaph looks as clear as Scrooge’s:
WESTERN RULE
1773–2103
R.I.P.
Yet are these really the shadows of the things that Will be?
Confronted with his own epitaph, Scrooge fell to his knees. “Good Spirit,” he begged, grabbing the specter’s hand, “assure me that I yet may change these shadows you have shown me, by an altered life!” Christmas Yet to Come said nothing, but Scrooge worked out the answer for himself. He had been forced to spend an uncomfortable evening with the Ghosts of Christmas Past and Christmas Present because he needed to learn from both of them. “I will not shut out the lessons that they teach,” Scrooge promised. “Oh, tell me I may sponge away the writing on this stone!”

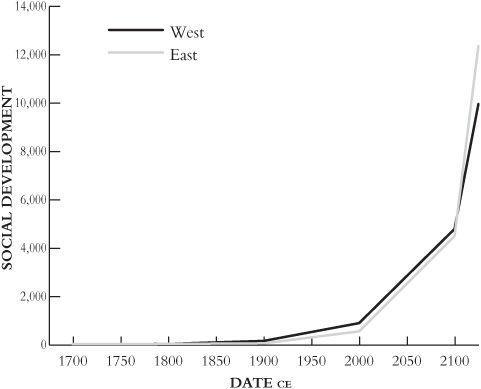
Figure 3.9. The shape of things to come? If we project the rates at which Eastern and Western social development grew in the twentieth century forward into the twenty-second, we see the East regain the lead in 2103. (On a log-linear graph, the Eastern and Western lines would both be straight from 1900 onward, reflecting unchanging rates of growth; because this is a linear-linear plot, both curve sharply upward.)
I commented in the introduction that I’m in a minority among those who write on why the West rules, and particularly on what will happen next, in not being an economist, modern historian, or political pundit of some sort. At the risk of overdoing the Scrooge analogy, I would say that the absence of premodern historians from the discussion has led us into the mistake of talking exclusively to the Ghost of Christmas Present. We need to bring the Ghost of Christmas Past back in.
To do this I will spend Part II of this book (
Chapters 4
–10) being a historian, telling the stories of East and West across the last few thousand years, trying to explain why social development changed as it did, and in Part III (
Chapters 11
and
12
) I will pull these stories together. This, I believe, will tell us not only why the West rules but also what will happen next.
________________________________
PART II

________________________________
4

THE EAST CATCHES UP
THE ELEPHANT IN THE ROOM
There is an old South Asian story about six blind men who meet an elephant. One grabs its trunk, and says it is a snake; another feels its tail, and thinks it is a rope; a third leans against a leg, and concludes it is a tree; and so on. It is hard to avoid thinking of this fable when reading long-term lock-in or short-term accident theories of Western rule: like the blind men, long-termers and short-termers alike tend to seize one part of the beast and mistake it for the whole. An index of social development, by contrast, makes the scales fall from our eyes. There can be no more nonsense about snakes, ropes, and trees. Everyone has to recognize that he or she is hanging on to just one piece of a tusker.
Figure 4.1
sums up what we saw impressionistically in
Chapter 2
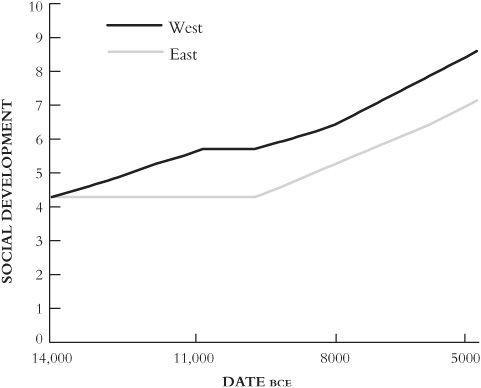
. At the end of the last ice age, climate and ecology conspired to set social development rising earlier in the West than in the East, and despite the climatic catastrophe of the Younger Dryas, the West maintained a clear lead. Admittedly, back in these early times before 10,000
BCE
our chainsaw art is very rough-and-ready indeed. In the East it is hard to detect any measurable change in social development for more than four thousand years, and even in the West, where development was clearly higher by 11,000
BCE
than it had been in 14,000, the subtleties of the changes are lost to us. Yet although the light the index casts is flickering and dim, a little light is better than none, and it reveals a very important fact: just as long-term lock-in theories predict, the West got a head start and held on to it.

Figure 4.1. The shape of things so far: the West’s early lead in social development between 14,000 and 5000
BCE
, as described in
Chapter 2
But
Figure 4.2
, continuing the story from 5000 through 1000
BCE
, is less straightforward. It differs as much from
Figure 4.1
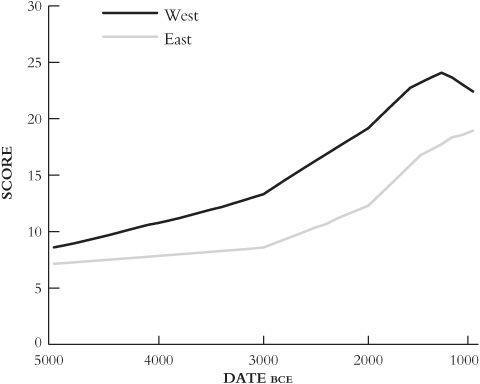
as, say, a rope from a snake. Like ropes and snakes, the two graphs do have similarities: in both graphs the Eastern and Western scores close higher than they started and in both, Western scores are always higher than Eastern. The differences, though, are just as striking. First, the lines rise much faster in
Figure 4.2
than in
Figure 4.1
. In the nine thousand years between 14,000 and 5000
BCE
the Western score doubled and the Eastern score increased by two-thirds, but in the next four thousand years—less than half the period covered by
Figure 4.1
—the Western score tripled and the Eastern increased two-and-a-half times. The second difference is that for the first time in history, we actually see social development falling in the West after 1300
BCE
.
In this chapter I try to explain these facts. I suggest that the acceleration and the West’s post-1300
BCE
decline were in fact two sides of
the same process, which I call the paradox of development. In the chapters that follow we will see that this paradox plays a major part in explaining why the West rules and in telling us what will happen next. But before we can get to that we need to look into exactly what happened between 5000 and 1000
BCE
.

Figure 4.2. Onward, upward, farther apart, and closer together: the acceleration, divergence, and convergence of Eastern and Western social development, 5000–1000
BCE
HOTLINES TO THE GODS
Between 14,000 and 5000
BCE
Western social development scores doubled and farming villages spread from their starting point in the Hilly Flanks deep into central Asia and to the shores of the Atlantic. Yet by 5000
BCE
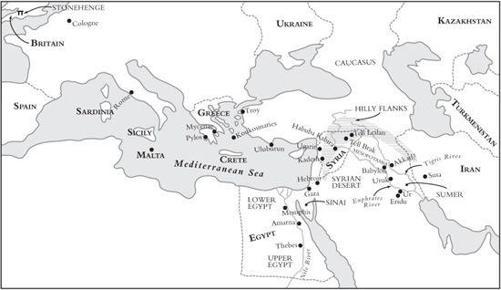
agriculture had hardly touched Mesopotamia, the “land between the rivers” that we now call Iraq, even though it was just a few days’ walk from the Hilly Flanks (
Figure 4.3
).
In a way, that is not surprising. Since 2003 news flashes have made the world all too familiar with Iraq’s harsh environment. Summer temperatures soar over 120°F, it hardly ever rains, and deserts press in on every side. It is difficult to imagine farmers ever choosing to live there, and back around 5000
BCE
Mesopotamia was even hotter. It was also wetter, though, and the main problem for farmers was not how to find water but how to manage it. Monsoon winds off the Indian Ocean brought some rain, though barely enough to support agriculture; but if farmers could control the summer floods of the mighty Tigris and Euphrates rivers and bring the waters into their fields at the right time to fertilize their crops, the possibilities were endless.

Figure 4.3. The expansion of the Western core, 5000–1000
BCE
: sites and regions mentioned in this chapter
The people who carried agricultural lifestyles over horizon after horizon across Europe, or who adopted agriculture from farming neighbors, were constantly tinkering with tradition to make farming work in new settings. Making techniques developed for rainfed agriculture in the Hilly Flanks work for irrigated farming in Mesopotamia took more than tinkering, though. Farmers had to start almost from scratch. For twenty generations they improved their canals, ditches, and storage basins; and gradually they made Mesopotamia’s marginal lands not just livable, but actually more productive than the Hilly Flanks had ever been. They were changing the meaning of geography.
Economists sometimes call this process the discovery of advantages of backwardness. When people adapt techniques that worked in an advanced core to operate in a less-developed periphery, the changes they introduce sometimes make those techniques work so well that the periphery becomes a new core in its own right. By 5000
BCE
this was happening in southern Mesopotamia, where elaborate canals supported some of the world’s biggest towns, with perhaps four thousand souls. Such crowds could build much more elaborate temples, and in one town, Eridu, we can trace superimposed temples on brick platforms from 5000 through 3000
BCE
, always using the same basic architectural plan but getting bigger and more ornate through time.
