The Source Field Investigations (60 page)
Read The Source Field Investigations Online
Authors: David Wilcock

Confounding the mainstream models, another “surprisingly dense” plasma tube was discovered in 2003, this time sharing the orbit of the moon Europa. In this case there are no volcanoes to account for where the charged particles are coming from.
67
As of about 2003, Europa’s aurora was observed to be substantially brighter than it was expected to be in a 1998 model.
68
The third large moon, Ganymede, has an aurora that became over 200 percent brighter between 1979 and the mid-1990s.
69
This increase in brightness is believed to be caused by a 1,000 percent increase in the density of Ganymede’s atmosphere since 1979.
70
Ganymede also has its own magnetic field, in defiance of all conventional expectations.
71
The fourth large moon, Callisto, was recently observed to have an aurora that is fully 100,000 percent higher in intensity than Jupiter’s own magnetic field in that area.
72
A third plasma tube, bigger than Io’s tube and the one in Europa’s orbit, was discovered in 1998. In defiance of all mainstream thought, it rotates in the opposite direction of Jupiter itself.
73
Counter-rotating fields are a basic aspect of the flowing interaction between the spin fields of space-time and time-space, as I have described in my other books on the Divine Cosmos Web site. Similarly, in 2007, Italian scientists discovered that our entire galaxy has two different halos, composed of different types of stars, which are counter-rotating inside of each other. Our Sun is part of one flattened halo of stars traveling at about twenty kilometers per second. A spherical halo of stars with a different chemical composition is counter-rotating at seventy kilometers per second.
74
Saturn67
As of about 2003, Europa’s aurora was observed to be substantially brighter than it was expected to be in a 1998 model.
68
The third large moon, Ganymede, has an aurora that became over 200 percent brighter between 1979 and the mid-1990s.
69
This increase in brightness is believed to be caused by a 1,000 percent increase in the density of Ganymede’s atmosphere since 1979.
70
Ganymede also has its own magnetic field, in defiance of all conventional expectations.
71
The fourth large moon, Callisto, was recently observed to have an aurora that is fully 100,000 percent higher in intensity than Jupiter’s own magnetic field in that area.
72
A third plasma tube, bigger than Io’s tube and the one in Europa’s orbit, was discovered in 1998. In defiance of all mainstream thought, it rotates in the opposite direction of Jupiter itself.
73
Counter-rotating fields are a basic aspect of the flowing interaction between the spin fields of space-time and time-space, as I have described in my other books on the Divine Cosmos Web site. Similarly, in 2007, Italian scientists discovered that our entire galaxy has two different halos, composed of different types of stars, which are counter-rotating inside of each other. Our Sun is part of one flattened halo of stars traveling at about twenty kilometers per second. A spherical halo of stars with a different chemical composition is counter-rotating at seventy kilometers per second.
74
Saturn’s own tube-shaped cloud of plasma energy became 1,000 percent denser than expected between 1981 and 1993.
75
Bright aurorae were seen at Saturn’s poles for the first time in 1995.
76
In 2008, NASA announced a “bright aurora” at Saturn’s north pole, which “covers an enormous area. . . . Our current ideas . . . predict that this region should be empty, so finding such a bright aurora here is a fantastic surprise.”
77
Clouds at Saturn’s equator slowed down by 58.2 percent between 1980 and 1996
78
—again suggesting a reduction in the “flow of time” similar to what we are seeing in the Sun. “Massive” emissions of X-rays from Saturn’s equatorial region were detected for the first time in 2004.
79
Such changes suggest that a fundamental shift has occurred within Saturn. In addition, curious dark areas named “spoke” formations were first observed in Saturn’s rings in 1980, and were seen to rotate faster than the rings themselves.
80
By December of 2003, scientists working with the Cassini probe—the first probe to return to Saturn since the Voyager missions in 1980–1981—were already getting excited about seeing the spoke formations in the rings again.
81
However, by February, 2004, the scientists acknowledged that the spokes were no longer visible.
82
A “gigantic storm” with lightning bolts a thousand times stronger than any seen on Earth was announced in 2006.
83
Saturn’s moon Titan appears to have had a 10–15 percent increase in the size of its atmosphere between 1980 and 2004.
84
However, if NASA’s more conservative, published estimates of Titan’s former atmosphere size at 250 kilometers are correct,
85
then Titan’s atmosphere may have actually expanded by as much as 200 percent in its overall height. Fast-moving, bright clouds have now been seen in Titan’s southern hemisphere, which are inexplicable in mainstream models.
86
Ozone atoms, again a sign of ionized plasma, were detected on Saturn’s moons Dione and Rhea in 1997.
87
A “severe storm” was seen for the first time near Titan’s equator in April 2008, blatantly contradicting NASA’s models and leaving scientists feeling puzzled.
88
Uranus84
However, if NASA’s more conservative, published estimates of Titan’s former atmosphere size at 250 kilometers are correct,
85
then Titan’s atmosphere may have actually expanded by as much as 200 percent in its overall height. Fast-moving, bright clouds have now been seen in Titan’s southern hemisphere, which are inexplicable in mainstream models.
86
Ozone atoms, again a sign of ionized plasma, were detected on Saturn’s moons Dione and Rhea in 1997.
87
A “severe storm” was seen for the first time near Titan’s equator in April 2008, blatantly contradicting NASA’s models and leaving scientists feeling puzzled.
88
Though Uranus “appeared as featureless as a cue ball” in 1986,
89
remarkably bright clouds began to appear as of at least 1996. By 1998, Hubble had discovered nearly as many clouds in a short time as had ever before been observed in the entire history of Uranus.
90
By 1999, NASA articles were referring to Uranus as being “hit” by “huge storms,” making it “a dynamic world with the brightest clouds in the outer solar system.”
91
-
92
The head NASA scientist referred to these increasingly bright and active clouds as “really big, big changes” on Uranus. In October 2000, a NASA briefing admits that “long-term ground-based observations [of Uranus are showing] seasonal brightness changes whose origins are not well understood.”
93
In November 2004, Uranus again made headlines: thirty distinct, large clouds were now visible—more than the entire amount of clouds ever counted prior to 2000—and these clouds were brighter than ever before.
94
According to one NASA scientist from Berkeley, “We have never seen such vigorous . . . activity in the southern hemisphere before. . . . Penetration of these clouds’ activity to higher altitudes is unprecedented.”
95
Additionally, carbon monoxide gas was detected in Uranus’s atmosphere for the first time in December 2003, and the scientists feel that this gas comes from dust flowing throughout the solar system.
96
“Dramatic changes” in Uranus’s rings were announced in 2007, including brightness increases, a potentially new ring and a cloud of dust particles pervading the entire ring system.
97
Neptune94
According to one NASA scientist from Berkeley, “We have never seen such vigorous . . . activity in the southern hemisphere before. . . . Penetration of these clouds’ activity to higher altitudes is unprecedented.”
95
Additionally, carbon monoxide gas was detected in Uranus’s atmosphere for the first time in December 2003, and the scientists feel that this gas comes from dust flowing throughout the solar system.
96
“Dramatic changes” in Uranus’s rings were announced in 2007, including brightness increases, a potentially new ring and a cloud of dust particles pervading the entire ring system.
97
By June 1994, Neptune’s Great Dark Spot, a circular feature in the southern hemisphere like the Great Red Spot on Jupiter, had disappeared. By March or April 1995, it had reappeared in the northern hemisphere. NASA said that this new spot was a “near-mirror image of the first spot previously imaged by Voyager 2.” This also led NASA scientists to say that “Neptune has changed radically since 1989.”
98
Two years later, NASA wrote of “a looming mystery”: The newly migrated spot “appears to be trapped at a fixed latitude” in its new position in the northern hemisphere.
99
This appears to have been caused by a perfect geometric shift in the grid, as the new northern latitude was the same as the southern. By 1996, less than a year after the “hyperdimensional pole shift,” Dr. Lawrence Sromovsky noticed an increase in Neptune’s overall brightness—which continued dramatically increasing through to 2002. Blue light became 3.2 percent brighter, red light 5.6 percent brighter and near-infrared light intensified by a whopping 40 percent. Some areas of latitude became fully 100 percent brighter.
100
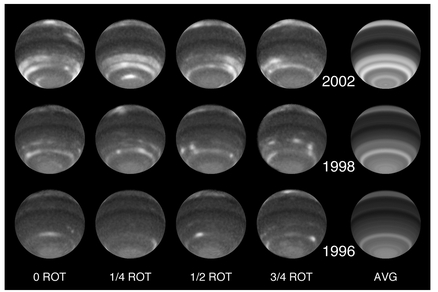
Between 1996 and 2002, Neptune’s brightness increased by 40 percent in the near-infrared range. The images on the far right are composites.
The physics to explain such a change in brightness are just not there in the conventional models, since Neptune “seems to run on almost no energy.”
101
Neptune’s south pole was found to be 18 degrees warmer than the rest of the planet in 2007.
102
101
Neptune’s south pole was found to be 18 degrees warmer than the rest of the planet in 2007.
102
Neptune’s moon, Triton, experienced a “very large” 5 percent temperature increase between 1989 and 1998. This is comparable with earth’s atmosphere heating up by twenty-two degrees Fahrenheit in only nine years.
103
It is believed that Triton’s atmospheric pressure has “at least doubled in bulk since the time of the Voyager encounter (in 1989).”
104
Pluto103
It is believed that Triton’s atmospheric pressure has “at least doubled in bulk since the time of the Voyager encounter (in 1989).”
104
Even though Pluto has been drifting away from the Sun since 1989, its atmospheric pressure increased by 300 percent between 1989 and 2002, causing a noticeable rise in surface temperatures. Again, this is attributed to “seasonal change.”
105
According to one leading NASA scientist, “The changes observed in Pluto’s atmosphere are much more severe [than in Triton’s]. . . . We just don’t know what is causing these effects.”
106
“These changes are not subtle.”
107
Indeed, the idea of “seasonal changes” being responsible for such a “severe” increase is said to be “counterintuitive.”
108
The NASA team acknowledges this unexpected “global warming” of Pluto, but says that it is “likely not connected with that of the Earth” since the “Sun’s output is much too steady.”
109
The scientists suggest “some longer-term change, analogous to long-term climatic changes on Earth” could be responsible for the massive global warming of Pluto.
110
The Associated Press revealed in February 2010 that Pluto’s colors did not change between 1954 and 2000, but then the red levels became 20 to 30 percent stronger by 2002.
111
In addition, “Nitrogen ice [is] shifting in size and density in surprising ways.”
112
Earth Changes Not Related to Industrial Pollution105
According to one leading NASA scientist, “The changes observed in Pluto’s atmosphere are much more severe [than in Triton’s]. . . . We just don’t know what is causing these effects.”
106
“These changes are not subtle.”
107
Indeed, the idea of “seasonal changes” being responsible for such a “severe” increase is said to be “counterintuitive.”
108
The NASA team acknowledges this unexpected “global warming” of Pluto, but says that it is “likely not connected with that of the Earth” since the “Sun’s output is much too steady.”
109
The scientists suggest “some longer-term change, analogous to long-term climatic changes on Earth” could be responsible for the massive global warming of Pluto.
110
The Associated Press revealed in February 2010 that Pluto’s colors did not change between 1954 and 2000, but then the red levels became 20 to 30 percent stronger by 2002.
111
In addition, “Nitrogen ice [is] shifting in size and density in surprising ways.”
112
Some Earth Changes cannot be attributed to human industrial pollution. According to NASA scientists, “Activity in [earth’s] two known Van Allen radiation belts grew so intense in May, 1998, that a new belt was created . . . generating excitement and awe in the scientific community.”
113
This new belt contains mostly ionized nitrogen, neon, and oxygen particles, which are new and unexpected since the inner Van Allen radiation belt itself consists mostly of protons.
114
The original source of the atoms is believed to be the local interstellar medium; i.e., the gas, dust and energy between the stars.
115
In February 1996, NASA’s “Tethered Satellite” experiment hoped to harness 3,500 volts of electricity from space, using a superstrong cable to stretch a satellite out away from the space shuttle and hold it there while the cable gathered energy. However, the satellite appeared to have encountered vastly more energy in the earth’s upper atmosphere than NASA had expected. First, it encountered a variety of mysterious problems; its “computer and two of its four gyroscopes had stopped working. In addition, both thrusters mysteriously had opened and spewed out nitrogen gas.”
116
These problems caused the experiment to be delayed—and are totally consistent with the observed electrical effects of what appears to be a vortex into time-space. When the satellite was finally deployed, the supposedly foolproof tether actually broke, sending the satellite reeling off into space—and NASA was unwilling to speculate as to the cause of the break,
117
or whether the earlier computer/gyroscope/thruster problems were related to the break itself.
118
Astronauts did describe that the tether’s “outer coating of nylon and Teflon looked charred and melted.”
119
Thus there appears to have been vastly more energy in earth’s upper atmosphere than earlier measurements had shown.
As of the mid-to-late 1990s, fully 5,060 percent more ozone was being detected in earth’s middle atmosphere than was expected, even though pollution is expected to reduce ozone, not increase it.
120
This area is above where the “ozone holes” are located. There are also more hydroxyl (OH) molecules appearing in earth’s upper atmosphere than conventional scientists can explain.
121
Furthermore, “strong emissions from atomic neon, argon and xenon” were seen in earth’s aurora, apparently for the first time, in 2001.
122
Overall, earth has been losing 3 percent of its sunlight per decade since the 1950s. There has been a 10 percent decrease in sunlight reaching earth’s surface in the last thirty years, and 15 percent over the last fifty years, showing that the effect is accelerating.
123
This suggests that the atmosphere itself has become noticeably denser. Most scientists would expect the earth to cool down as a result of a thicker atmosphere, not warm up, so this “shocking” finding “went against all scientific thinking” and was “ignored” as a result. “The first reaction has always been that the effect is much too big, I don’t believe it and if it’s true then why has nobody reported it before.”
124
NASA announced in 2009 that over the last twenty-five years, noctilucent clouds in earth’s upper atmosphere are becoming more and more frequent, migrating down from the poles, and shining brighter than ever before.
125
This cannot be attributed to a change in temperature, and atmospheric scientist Dr. Vincent Wickwar said, “I suspect, as many of us feel, that it is global change, but I fear we don’t understand it. . . . It’s not as simple as a temperature change.”
126
125
This cannot be attributed to a change in temperature, and atmospheric scientist Dr. Vincent Wickwar said, “I suspect, as many of us feel, that it is global change, but I fear we don’t understand it. . . . It’s not as simple as a temperature change.”
126
The oceans of the world have warmed significantly since the late 1940s, and interestingly, slightly less than half of the increase in heat content is occurring below three hundred meters (roughly nine hundred feet).
127
These rapid, unpredictable changes in temperature were previously thought impossible, since sunlight cannot penetrate to these depths.
128
These subsurface temperature changes can predict the behavior of surface weather several months later.
129
130
131
There are temperature anomalies in the deepest levels of the Pacific Ocean that exhibit a slow, clockwise circulating movement,
132
and these deep temperature anomalies are neatly correlated with variations in solar energy output. This has allowed for the creation of a successful model to predict El Niño and La Niña events in advance.
133
Other books
The Book of Awesome by Pasricha, Neil
Pond: Stories by Claire-Louise Bennett
Hot Shot (A Hostile Operations Team Novel)(#5) by Lynn Raye Harris
Steel Beneath the Skin by Niall Teasdale
On His Terms by Jenika Snow
Come Together by Jessica Hawkins
As Old As Time: A Twisted Tale (Twisted Tale, A) by Liz Braswell
Lady Olivia To The Rescue by Julia Parks
Cuentos de un soñador by Lord Dunsany