Read The Bell Curve: Intelligence and Class Structure in American Life Online
Authors: Richard J. Herrnstein,Charles A. Murray
Tags: #History, #Science, #General, #Psychology, #Sociology, #Genetics & Genomics, #Life Sciences, #Social Science, #Educational Psychology, #Intelligence Levels - United States, #Nature and Nurture, #United States, #Education, #Political Science, #Intelligence Levels - Social Aspects - United States, #Intellect, #Intelligence Levels
The Bell Curve: Intelligence and Class Structure in American Life (75 page)

In this chapter, the topic is the college campus. In Chapter 20, we discuss affirmative action in the workplace. In both chapters, we provide data as available on Asians and Latinos, but the analysis centers on blacks, as has the debate over affirmative action.
People may agree that they want affirmative action in higher education until they say more precisely what they mean by it. Then they may disagree. But whatever the argument, it would help to have some data about how colleges and universities have translated the universal desire for greater fairness in university education into affirmative action programs. Our first goal is to inform the debate with such data.
At first glance, ours may seem an odd objective, for certain kinds of data about affirmative action are abundant. Universities and businesses keep detailed numbers about the numbers of minorities who apply and are accepted. But data about the core mechanism of affirmative action—the
magnitudes of the values assigned to group membership—are not part of the public debate.
This ignorance about practice was revealed in 1991 by a law student at Georgetown University, Timothy Maguire, who had been hired to file student records.
2
He surreptitiously compiled the entrance statistics for a sample of applicants to Georgetown’s law school and then published the results of his research in the law school’s student newspaper. He revealed that the mean on the Law School Aptitude Test (LSAT) differed by a large margin for accepted black and white students.
In the storm that ensued, an official at the law school sent a letter to Maguire’s fellow students condemning his article. Black student groups called for Maguire’s expulsion. Hardly anyone would acknowledge that Maguire’s numbers even raised a legitimate issue. “Incomplete and distorted information about minority qualifications for admission into the Law Center renew the long-standing and intellectually dishonest myth that they are less qualified than their white counterparts to compete in school, perform on the job or receive a promotion,” wrote the authors of an op-ed article in the
Washington Post,
3
and that seemed to be the prevailing attitude. The numerical magnitude of the edge given to members of certain groups—the value assigned to the state of being black, Latino, female, or physically disabled—was not considered relevant.
Such edges are inherent in the process. In as neutral and precise language as we can devise: Perfectly practiced, the traditional American ideal of equal opportunity means using exclusively individual measures, applied uniformly, to choose some people over others. Perfectly practiced, affirmative action means assigning a premium, an edge, to group membership in addition to the individual measures before making a final assessment that chooses some people over others.
The size of the premium assigned to group membership—an ethnic premium when it is applied to affirmative action for favored ethnic groups—is important in trying to judge whether affirmative action in principle is working. This knowledge should be useful not only (or even primarily) for deciding whether one is “for” or “against”affirmative action in the abstract. It should be especially useful for the proponents of affirmative action. Given that one is in favor of affirmative action, how may it be practiced in a way that conforms with one’s overall notions of what is fair and appropriate? If one opposes affirmative action in principle, how much is it deforming behavior in practice?
It is not obvious precisely where questions of fact trail into questions
of philosophy, but we will attempt to stay on the factual side of the line at first. A bit of philosophical speculation is reserved for the end of the chapter. We first examine evidence on the magnitude of the ethnic premium from individual colleges and universities, then from professional schools. We then recast the NLSY data in terms of the rationale underlying affirmative action. We conclude that the size of the premium is unreasonably large, producing differences in academic talent across campus ethnic groups so gaping that they are in no one’s best interest. We further argue that the current practice is out of keeping with the rationale for affirmative action.
We have obtained SAT data on classes entering twenty-six of the nation’s top colleges and universities. In 1975, most of the nation’s elite private colleges and universities formed the Consortium on Financing Higher Education (COFHE), which, among other things, compiles and shares information on the students at member institutions, including their SAT scores. We have obtained these data for the classes entering in 1991 and 1992.
4
They include sixteen out of the twenty top-rated private universities and five of the top ten private colleges, as ranked in
U.S. News and World Report
for 1993.
5
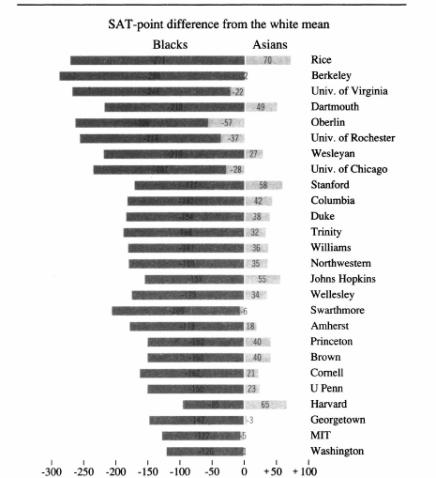
The figure below shows the difference in the sum of the average Verbal and Math SAT scores between whites and two minorities, blacks and Asians, for the classes in the COFHE schools that matriculated in the fall of 1992. In addition, the figure includes data on the University of Virginia and the University of California at Berkeley in 1988.
6
The difference between black and white scores was less than 100 points at only one school, Harvard. It exceeded 200 points at nine schools, reaching its highest at Berkeley (288 points). Overall, the median difference between the white mean and the black mean was 180 SAT points, or, conservatively estimated, about 1.3 standard deviations.
7
This would put the average black at about the 10th percentile of white students. In all but four schools, Asians were within 6 points of the white mean or above it, with a median SAT 30 points above the local white average, working out to about .2 standard deviations. Or in other words, the average Asian was at about the 60th percentile of the white distribution. This combination means that blacks and Asians have even less overlap than blacks and whites at most schools, with the
median black at the 5th to 7th percentile of the distribution of Asian students. Data for Latinos (not shown in the figure) put them between blacks and whites, with a median of 129 points below the white mean, or about .9 standard deviation below the white mean in the typical case. The average Latino is therefore at about the 20th percentile of the distribution of white students.
8
At selective schools, the median black edge was 180 SAT points, while Asians faced a median penalty of 30 points
Sources:
Consortium on Financing Higher Education 1992; Sarich 1990 (for Berkeley); L. Feinberg, “Black freshman enrollment rises 46% at U-Va,”
Washington Post,
Dec. 26, 1988, p. C1 (for University of Virginia).
The ordering of black, Latino, white, and Asian is similar to that reported for IQ and SAT scores in Chapter 13. In other words, elite universities are race norming (though it is doubtful they think of it that way), carrying with them into their student populations the ethnic differences in cognitive distributions observed in the population at large.
We would prefer to have a sample of nonelite state universities represented in our data, but such numbers are closely guarded.
9
The only data we have obtained come from the University of California at Davis, for 1979. The black-white difference then was 271 SAT points, and the Latino-white difference 211 points.
10
The Asian mean at Davis was, atypically, 54 points
below
the white mean, the largest such difference we have found.
The data from the University of Virginia and the two University of California campuses suggest that the gap between minorities and whites among freshmen at state universities may be larger than at the elite private schools. It is only a suggestion, given the limited data, but it also makes sense: Places like Harvard, Stanford, Yale, and MIT get first pick. Because the raw numbers of high-scoring black and Latino students are so small, the top schools dig deep into the thin layer of minority students at the top of the SAT distribution. In 1993, for example, only 129 blacks and 234 Latinos nationwide had SAT-Verbal scores in the 700s—and these represented all-time highs—compared to 7,114 whites. Even highly rated state institutions such as the University of California’s Berkeley campus and the University of Virginia lose many of these most talented minority students to the elite private schools while continuing to get many of the top scorers in the larger white pool. Such are the mathematics of competition for a scarce good, borne out by the limited university data available, which show the three state universities with three of the four largest black-white gaps in SATs.
Are Asians the Victims of Reverse Discrimination?
Complaints that Asian-American applicants were being subjected to reverse discrimination led eventually to a full-scale inquiry in the late 1980s by the federal Office for Civil Rights. Harvard, which was examined closely, was able to show that the SAT penalty of their Asian admitted students was accounted for by the smaller number of alumni children and athletes in the pool, and eventually got a clean bill of health, but the controversy remains at many other institutions.
11
Brown responded to a report from its Asian-American Students Association by admitting the existence of “an extremely serious situation” and called for “immediate remedial measures.”
12
At Berkeley, Stanford, Princeton, and other elite schools, special committees have investigated the issue, issuing reports that tend to exonerate their colleges of actual reverse discrimination but acknowledge shortcomings in keeping up with the revolution in Asian applicants.
13The underlying source of tension remains: Asians are an ethnic minority, many of whom, or whose parents, came to the United States under circumstances of extreme deprivation. Many suffered from racial prejudice. Whether or not they are treated differently from whites by elite universities, Asians are indisputably treated differently from every other nonwhite ethnic minority. University officials everywhere have been reluctant to confront this issue forthrightly.
The Law of Supply and Demand in Minority Recruiting
Affirmative action has produced intense competition for the top black and Latino students. In the spring of 1992, Harvard reported that its “yield” of black students abruptly declined from the year before. The Harvard report suggested that the decline was due at least in part to the large financial incentives being offered to blacks by other colleges. One such black student, it was reported, received a straight grant of $85,000, plus $10,000 in annual travel budgets, from one of Harvard’s competitors in minority recruiting.
14
An article in the
New York Times
provided more instances of a practice that increasingly includes the kind of enticements—full scholarships even for families with ample financial resources, free trips to visit the campus, recruiting visits, and promotional activities—that used to be reserved for star high school athletes. “As a result, a number of college officials privately accuse each other of ‘stealing’ black students,” the
Times
reporter noted.
15
The differences do not seem to have changed a great deal between the 1970s and the 1990s. The best longitudinal data from Berkeley illustrate a perverse effect of a strong affirmative action policy: The more aggressive the recruitment of minorities, the higher the average ability of the
nonminority
students. From 1978 to 1988, the combined SATs of blacks at Berkeley rose by 101 points, a major improvement in the academic quality of black students at Berkeley. But the competition for the allotment of white slots became ever more intense. The result was that
the SAT scores for Berkeley whites rose too, and the gap between black and white students at Berkeley did not close but widened.
16
Meanwhile, the unprotected minority, Asians, also were competing for a restricted allotment of slots. Their mean scores rose more than any other group’s, and by a large margin, going from far below the white mean to slightly above it. In just eleven years, the Asian mean at Berkeley soared by 189 points.
The summary statement about affirmative action in undergraduate institutions is that being either a black or a Latino is worth a great deal in the admissions process at every undergraduate school for which we have data. Even the smallest known black-white difference (95 points at Harvard) represents close to a standard deviation for Harvard undergraduates. The gap in most colleges is so large that the black and white student bodies have little overlap. The situation is less extreme for Latino students but still severe. Asian students appear to suffer a penalty for being Asian, albeit a small one on the average. We have seen no data that would dispute this picture. If such data exist, perhaps this presentation will encourage their publication.
