Read The Bell Curve: Intelligence and Class Structure in American Life Online
Authors: Richard J. Herrnstein,Charles A. Murray
Tags: #History, #Science, #General, #Psychology, #Sociology, #Genetics & Genomics, #Life Sciences, #Social Science, #Educational Psychology, #Intelligence Levels - United States, #Nature and Nurture, #United States, #Education, #Political Science, #Intelligence Levels - Social Aspects - United States, #Intellect, #Intelligence Levels
The Bell Curve: Intelligence and Class Structure in American Life (101 page)

These are the results using the categorization into cognitive classes by centile:
| | | Whole-Model Test | | |
| Source | DF | -LogLikelihood | ChiSquare | Prob>ChiSq |
| Model | 6 | 383494.7 | 766989.4 | 0.000000 |
| Error | 4485 | 4680894.0 | | |
| C Total | 4491 | 5064388.7 | | |
| | RSquare (U) | 0.0757 | | |
| | Observations | 4,492 | |
| | Parameter Estimates | | ||
| Term | Estimate | Std Error | ChiSquare | Prob>ChiSq |
| Intercept | -2.5097718 | 0.0015823 | . | 0.0000 |
| CogClas.[1-5] | -1.0067168 | 0.0050693 | 39439 | 0.0000 |
| CogClas.[2-5] | -0.6803606 | 0.0025486 | 71265 | 0.0000 |
| CogClas.[3-5] | -0.1905042 | 0.0018498 | 10606 | 0.0000 |
| CogClas.[4-5] | 0.64764109 | 0.0021336 | 92138 | 0.0000 |
| zSES | -0.3902981 | 0.0011276 | 119800 | 0.0000 |
| zAge | -0.1605992 | 0.000907 | 31350 | 0.0000 |
We repeated these comparisons for a broad sampling of the outcome variables discussed in Part IL The results for poverty were typical When the results for the two expressions of IQ do not correspond (e.g., the relationship of mother’s IQ to low birth weight, as discussed in Chapter 10), the lack of correspondence also showed up in the bivariate table showing the breakdown by cognitive class. Or to put it another way, the results presented in the text using IQ as a continuous, normally distributed variable are produced as well when IQ is treated as a set of categories.
Any exceptions to that may be identified through the bivariate tables based on cognitive class.
The relationship of an IQ test score to education and socioeconomic background is a constant and to some extent unresolvable source of controversy. It is known that the environment (including exposure to education) affects realized cognitive ability. To that extent, it is conceptually appropriate that parental SES and years of education show an independent causal effect on IQ. On the other hand, an IQ test score is supposed to represent cognitive ability and to have an independent reality of its own; in other words, it should not simply be a proxy measure of either parental SES or years of education. The following discussion elaborates on the statistical relationship of both parental SES and years of education to the AFQT score.
The SES index consists of four indicators as described in Appendix 2: mother’s and father’s years of education, the occupational status of the parent with the higher-status job, and the parents’ total family income in 1979-1980. The correlations of the index and its four constituent variables with the AFQT are in the table below.
| Intel-correlations of the AFQT and the Indicators in the Socioeconomic Status Index | |
|---|---|
| | AFQT |
| Mother’s education | .43 |
| Father’s education | .46 |
| Occupational status | .43 |
| Family income | .38 |
| SES Index | .55 |
The correlation of AFQT with the SES index itself is .55, consistent with other investigations of this topic.
16
There are three broad interpretations of these correlations:
- Test bias.
IQ tests scores are artificially high for persons from highstatus backgrounds because the tests are biased in favor of people from high-status homes. - Environmental advantage.
IQ tends to be genuinely higher for children from high-status homes, because they enjoy a more favorable environment for realizing their cognitive ability than do children from low-status homes. - Genetic advantage.
IQ tends to be genuinely higher for children from high-status homes because they enjoy a more favorable genetic background (parental SES is a proxy measure for parental IQ).
The first explanation is discussed in Appendix 5. The other two explanations have been discussed at various points in the text (principally Chapter 4’s discussion of heritability, Chapter 10’s discussion of parenting styles, and Chapter 17’s discussion of adoption). To summarize those discussions, being brought up in a conspicuously high-status or low-status family from birth probably has a significant effect on IQ, independent of the genetic endowment of the parents. The magnitude of this effect is uncertain. Studies of adoption suggest that the average is in the region of six IQ points, given the difference in the environments provided by adopting and natural parents. Outside interventions to augment the environment have had only an inconsistent and uncertain effect, although it remains possible that larger effects might be possible for children from extremely deprived environments. In terms of the topic of this appendix, the flexibility of the AFQT score, the AFQT was given at ages 15-23, when the effect of socioeconomic background on IQ had already played whatever independent role it might have.
For the AFQT as for other IQ tests, scores vary directly with educational attainment, leaving aside for the moment the magnitude of reciprocal cause and effect. But to what extent could we expect that, if we managed to keep low-scoring students in school for another year or two, their AFQT scores would have risen appreciably?
Chapter 17 laid out the general answer from a large body of research: Systematic attempts to raise IQ through education (exemplified by the Venezuelan experiment and the analyses of SAT coaching) can
indeed have an effect on the order of 2 standard deviation, or three IQ points. As far as anyone can tell, there are diminishing marginal benefits of this kind of coaching (taking three intensive SAT coaching programs in succession will raise a score by less than three times the original increment).
We may explore the issue more directly by making use of the other IQ scores obtained for members of the NLSY. Given scores that were obtained several years earlier than the AFQT score, to what extent do the intervening years of education appear to have elevated the AFQT?
Underlying the discussion is a simple model:
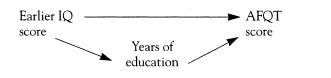
The earlier IQ score affects both years of education and is a measure of the same thing that AFQT measures. Meanwhile, the years of education add something (we hypothesize) to the AFQT score that would not otherwise have been added.
Actually testing the model means bringing in several complications, however. The elapsed time between the earlier IQ test and the AFQT test presumably affects the relationships. So does the age of the subject (a subject who took the test at age 22 had a much different “chance” to add years of education than did a subject who took the test at age 18, for example). The age at which the earlier IQ test was taken is also relevant, since IQ test scores are known to become more stable at around the age of 6. But the main point of the exercise may be illustrated straightforwardly. We will leave the elaboration to our colleagues.
The database consists of all NLSY students who had an earlier IQ test score, as reported in the table on page 596, plus students with valid Stanford-Binet and WISC scores (too few to report separately). We report the results for two models in the table below, with the AFQT score as the dependent variable in both cases. In the first model, the explanatory variables are the earlier IQ score, elapsed years between the two tests, and type of test (entered as a vector of dummy variables). In the second model, we add years of education as an independent variable. An additional year of education is associated with a gain of 3.2 centiles per year, in line with other analyses of the effects of education
on IQ.
17
What happens if the dependent variable is expressed in standardized scores rather than percentiles? In that case (using the same independent variables), the independent effect of education is to increase the AFQT score by .11 standard deviation—also in line with other analyses.
| The Independent Effect of Education on AFQT Scores as Inferred from Earlier IQ Tests | ||||
|---|---|---|---|---|
| Dependent variable: AFQT percentile score | | | ||
| Independent Variables | Model 1 | Model 2 | ||
| | Coefficient | Std. Error | Coefficient | Std. Error |
| Intercept | 12.312 | 1.655 | -14.331 | 2.780 |
| Earlier IQ percentile score | .787 | .016 | .736 | .016 |
| Elapsed years between tests | -.316 | .166 | -1.288 | .179 |
| Years of education | — | — | 3.185 | .273 |
| Type of test (entered as a vector of nominal variables, coefficients not shown.) | | | | |
| No. of observations | 1,404 1, | | 404 | |
| R2 (Adjusted) | .656 | | .686 | |
We caution against interpreting these coefficients literally across the entire educational range. Whereas it may be reasonable to think about IQ gains for six additional years of education when comparing subjects who had no schooling versus those who reached sixth grade, or even comparing those who dropped out in sixth grade and those who remained through high school, interpreting these coefficients becomes problematic when moving into post-high school education.
The negative coefficient for “elapsed years between tests” in the table above is worth mentioning. Suppose that the true independent relationship between years of education and AFQT is negatively accelerated—that is, the causal importance of the elementary grades in developing a person’s IQ is greater than the causal role of, say, graduate school. If so, then the more years of separation between tests, the lower would be the true value of the dependent variable, AFQT, compared to
the predicted value in a linear regression, because people with many years of separation between tests in the sample are, on average, getting less incremental benefit of years of education than the sample with just a few years of separation. The observed results are consistent with this hypothesis.
Regression Analyses from Part II
This appendix presents the logistic regressions for the figures in Chapters 5 through 12. In the text, the figures are based on regressions that use the entire white sample in the NLSY and are calculated using sample weights. We use the entire sample and weights to take advantage of the NLSY’s supplemental sample of low-income whites; in our judgment, doing so provides the best available estimates of the relationships we discuss. But interpreting standard errors and statistical significance is greatly complicated when using sample weights. In the regression results that follow, we therefore restrict the analyses to the nationally representative cross-sectional sample of whites. This procedure not only enables direct interpretation of the standard errors but also provides the raw material for interested readers to see how much difference there is between the results from the entire white sample and the cross-sectional sample (which you may do by computing the probabilities for the cross-sectional sample and comparing them to the ones shown in the text figures). We have done so ourselves and can report that the differences are so small that they are seldom visually evident.
By “whites,” we mean all NLSY subjects who were identified as “non-black, non-Hispanic” in the NLSY’s racial/ethnic cohort screening (variable R2147, in the NLSY’s documentation), deleting those who identified themselves as being of American Indian, Asian, or Pacific descent in the “first or only racial/ethnic origin” item (R96).
In the text, we do not refer to the usual measure of goodness of fit for multiple regressions,
R
2, but they are presented here for the cross-sectional analyses. As the ratio of the explained sum of squares to the total sum of squares,
R
2 is in this instance the square of the correlation between the set of independent variables and the dependent variable expressed as the logarithm of the odds ratio. Inasmuch as the values of
R
2 range widely in the tables to follow, some mention of them is warranted.
