Reverse Deception: Organized Cyber Threat Counter-Exploitation (96 page)
Read Reverse Deception: Organized Cyber Threat Counter-Exploitation Online
Authors: Sean Bodmer
Tags: #General, #security, #Computers

Taxonomy of the separate SpyEye botnet operators
Traffic Analysis
Traffic analysis for SpyEye reveals particular information about the specific exploits incurred by the botnet operators, as well as their motives. Acquiring intelligence early on about an increasing threat such as SpyEye is essential in order to gain an upper hand against such malice. Performing traffic analysis is an effective method to obtain information about the intentions and actions of an enemy. In this case, we were investigating an operator of SpyEye using the tool to steal credentials and financial information from unsuspecting computer users.
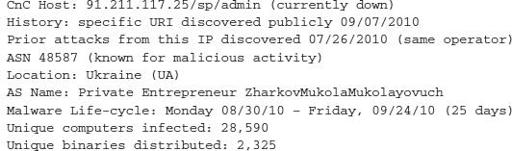
Unfortunately, the initiation period of this specific operator’s attack remained unreported publicly for eight days, likely enabling an effective infection rate. Supporting this theory, we found that on the first day of this SpyEye campaign, the operator fortuitously exploited 11,678 unique computers (approximately one host was infected every seven seconds on the first day), and then proceeded to update the bots immediately with 94 different binaries. This is usually an attempt to prevent antivirus software from detecting anything that was possibly discovered in the wild, essentially ensuring a longer life cycle and obviously more profit.
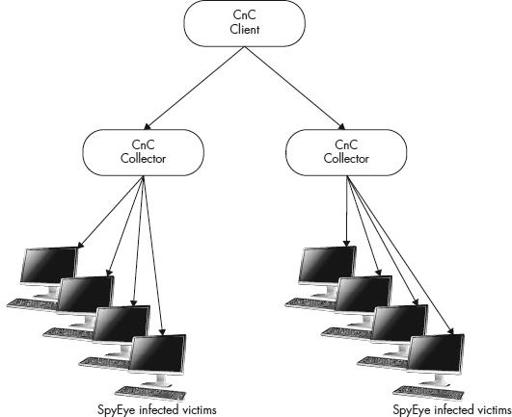
Figure 9-13
The general SpyEye botnet configuration
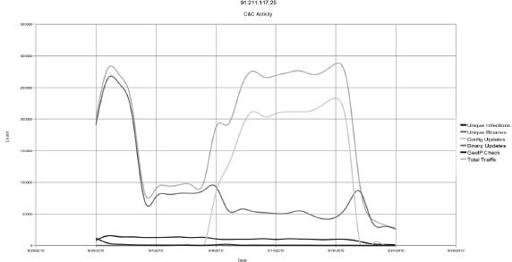
The traffic analysis targeted at this specific malware expedition enables us to gauge the success of this operator’s attacks and, in general, the potential of the threats that exist on the Internet. The following are some observations exhibited through this type of analysis:
Figures 9-14
and
9-15
provide a general idea of the daily infection rate. These graphs measure total traffic activity based on the types of requests that are made to the hosts. It is interesting to note that at the beginning stages of the CnC activity, the priority seems to be focused on updating the bots with new binaries (naturally a protective measure). Coincidentally, around the same time that this specific site was reported as malicious, we observed that the main type of traffic became focused on updating configurations on the botnets. This continued until the end of the life cycle and ceased abruptly when the site was shut down on September 24. This could suggest that the majority of stability is determined after a week of protecting the infected hosts from detection, and the interactive malicious behavior between the botnet operator starts within the next week of the life cycle (since configuration updates include task loading as well as setting up infected hosts).
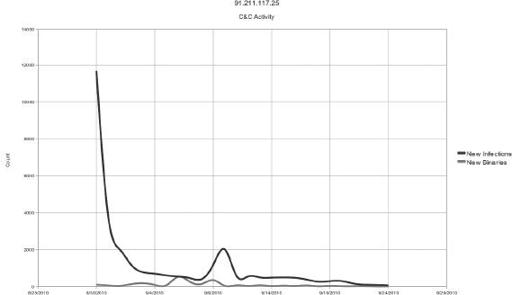
Figure 9-14
Infection and binary distribution