Reverse Deception: Organized Cyber Threat Counter-Exploitation (103 page)
Read Reverse Deception: Organized Cyber Threat Counter-Exploitation Online
Authors: Sean Bodmer
Tags: #General, #security, #Computers

A large list of individuals that he claims as friends
A list of those friends who have reciprocated the relationship by listing him as a friend on their LiveJournal webpage
Using a standard link analysis, profilers can build a fairly elaborate and extensive database structure that can be used to connect individuals to each other. Additionally, this information can be used to do more formal social network analysis, where profilers can identify different nodes or individuals within the network and ascribe specific social network metrics to them. Using the social network analysis option of a commercial platform such as Analyst’s Notebook or free network analysis packages such as Pajek,
4
profilers can estimate a number of social networking metrics. They can ascertain the neighborhood for a particular actor/node, determine the degree and degree centrality of actors/nodes, and measure distances between actors/nodes of interest.
Figure 10-2
illustrates a simple social network structure that might represent two very small hacking groups. One group contains foo, Amy, dng3r, and k4. The other hacking group consists of pwnr, b0b, d00d l33t, and k4. Notice that k4 belongs to two different hacking groups. This is not at all unusual; you will often find actors that belong to two or more groups. These dual membership individuals often play an important role in intergroup communications and relationships.

Figure 10-2
Example of a simple social network
The lines between the nodes in
Figure 10-2
represent friendship ties. When any two nodes have a direct line between them, they are said to be adjacent, and the entire set of individuals that are adjacent to a specific node or actor is said to constitute that node’s neighborhood (Scott, 2000). For example, the neighborhood for b0b consists of members d00d, pwnr, and k4. Neighborhoods are a useful concept when attempting to learn more about a specific target such as b0b. While information about b0b may be scarce, you might be able to collect either direct or inferred information about b0b through one or more of the individuals in his neighborhood.
The centrality of a node can also play an important part in analyzing the structures of hacking or cyber crime groups. The most common metric of centrality in social network analysis is degree centrality. Degree is the number of lines that connect a node directly to other nodes. Thus, a high degree for a specific node also denotes a high level of degree centrality (Nooy et al, 2005). In
Figure 10-2
, k4 has a high degree of centrality in comparison with some of the other actors in the social network. Degree centrality can be useful to identify various characteristics of actors or nodes within the social network diagram, such as evaluating the popularity of an individual. In the case where lines indicate communication paths, a node with a high level of degree centrality can suggest a communications hub or an actor critical to communications within the network.
There are other measures of centrality at the individual node level as well as aggregated across an entire network,
5
but the idea here is that measures of local network centrality help profilers and investigators identify key individuals or entities that play an important role in the network. Once these individuals are identified, the investigators can determine what further measures they might deploy against these central targets.
Centrality can also play a part in the analysis of diffusion processes as well. The rate at which the diffusion of some object, such as a piece of information or an exploit, occurs depends to some extent on the centrality of the node that originated that object (Nooy et al, 2005). For example, an exploit that originates from a node/actor that has high centrality will diffuse faster on average than an exploit that originates from a node/actor that has lower centrality. If analysts can obtain a timeline of the diffusion of an exploit, they may be able to work backward in time to estimate the centrality of the originating node or actor, which may give them an additional profile characteristic that could be helpful in identifying the original source of the exploit. This relationship could also be used in the situation where analysts have identified an actor who has developed an exploit that he has kept to himself. In this situation, the analyst may be able to estimate the temporal window of the diffusion process if and when the exploit is released by examining the degree centrality of that actor within his larger social network.
The profiler or analyst does not necessarily need to have an extensive background in social network analysis to extract useful information from social network diagrams of malicious online actors. Sometimes just a visual inspection of a social networking diagram can unveil some interesting and useful information. Let’s take the original social network diagram shown in
Chapter 4
(Holt et al, 2010) and annotate it a bit in our example, as shown in
Figure 10-3
.

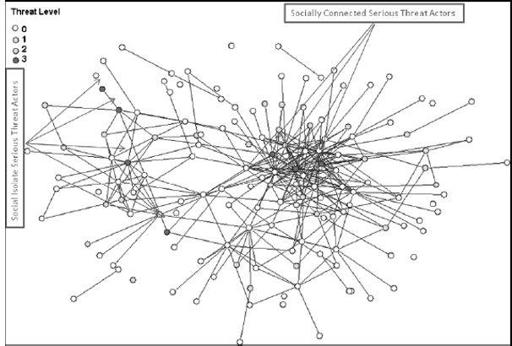
Figure 10-3
Mutual friends networks
Notice that there appear to be two sets of nodes or actors that are considered serious threats here. The first set includes three actors (identified by a red circle in the color version of the diagram) who reside in the center of the friendship network and appear, from visual inspection, to have a high level of degree centrality. The second set, on the left side of the diagram, consists of four serious threat actors who are more typically social isolates. We know from the previous discussion that the high centrality, high threat group likely has a faster exploit diffusion rate than the socially isolated high threat group. Thus, any malware that escapes from these individuals is likely to spread to more malicious actors faster, and thus has a higher probability of being modified, adapted, and deployed.
Another perspective on the social network diagram shown in
Figure 10-3
involves the socially isolated serious threat group of four actors. Why is the degree for these actors significantly lower than for the other high risk group? Is it because these are individuals who have purposely declined to form friendship bonds with other hackers in order to lower the probability of detection and identification? Or perhaps the motivation for these individuals is different from that of the others in the social network diagram. If these actors were motivated by money, for example, and the other actors in the network were driven primarily by other motivations such as ego or status, then this could also explain the social isolation of this second set of serious threat actors. It is also possible that these individuals are members of an unidentified group.
Another social networking diagram taken from the same study (Holt et al, 2010) can also yield some useful information from visual inspection.
Figure 10-4
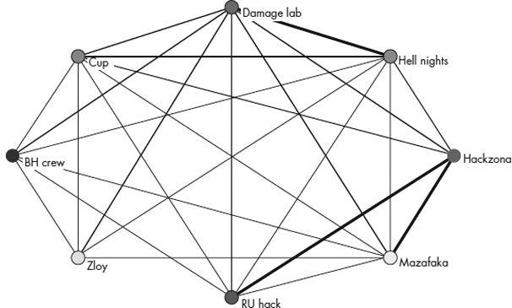
shows a social networking diagram that uses the different Russian hacking groups as nodes in the network.

Figure 10-4
Strength of group ties
The thickness of the lines connecting adjacent nodes represents the strength of friendship ties between the groups. A thick line means that there are a large number of total friendship relationships between members in each group. A thin line means that there are a small number of friendship ties between the two adjacent groups.
A simple inspection of the diagram in
Figure 10-4
reveals that Hackzona and RUhack seem to be strongly cemented to each other in terms of friendship ties. On the other hand, there appears to be only a few friendship ties between BHCrew and Mazafaka. This information could be useful in a number of ways. One way is that it suggests the likely paths that exploits might take when they are finally diffused out of the originating hacking group. There is a good chance that the exploit will follow stronger friendship ties when traversing one hacking group to another. Another interpretation could be that the lack of friendship ties for a specific hacking group indicates that the group members are deliberately isolating themselves from other hacking groups and individuals in order to minimize their signature and the amount of information that is known about them. A third possibility is that the linkages between the groups have been obscured by their use of a cutout or intermediary whose knowledge of the actors in the social network is generally very limited.
Another use for this network diagram is to assess the potential for collaboration or even a merger among these Russian hacking gangs. The larger the number of friendship ties between two groups, the more likely that there may be cross-gang collaboration or even mergers. If there is a potential breakup of one of the groups, this diagram also might be useful in predicting which of the groups would be the most likely recipients of “refugees” from the disintegrated group.
Finally, this diagram may also prove to be useful for proactive counterintelligence purposes. If it turns out to be difficult to insert someone into a specific hacking group represented here—Damage Lab, for example—then it might be possible to insert an agent into one of the other groups that has a large number of friendship ties with Damage Lab, such as Hell Nights. Once inserted, the agent can then work on establishing reputation and rapport within Hell Nights, especially with individuals who, according to the social networking diagram, have a number of friendship ties with members in Damage Lab. Eventually, this may allow the agent to assimilate himself into the targeted Damage Lab hacking group over time and carry out the objectives assigned to that individual.
