Homage to Gaia (71 page)
Authors: James Lovelock

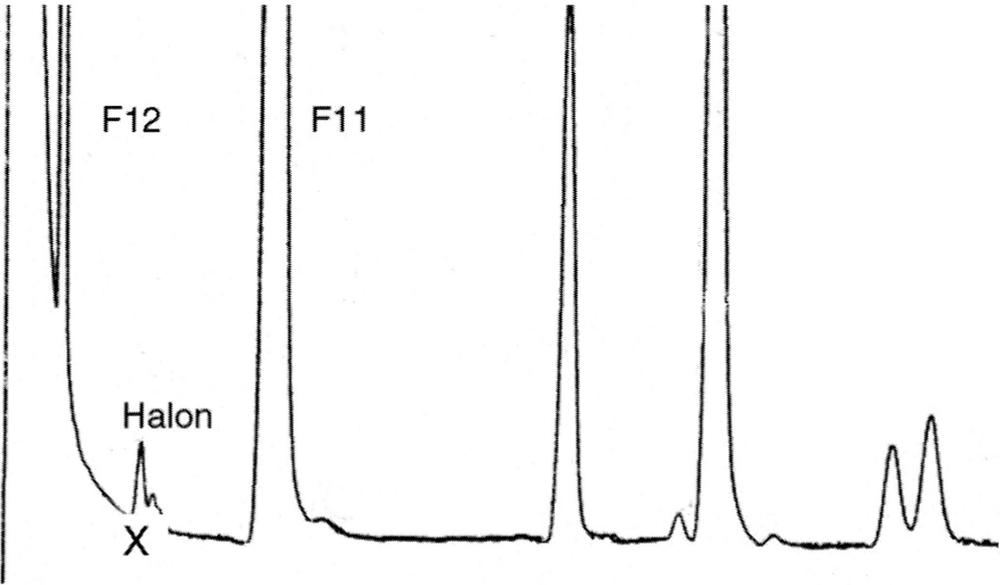
Figure 1.
A chromatogram to illustrate the sensitivity of the ECD. The peak ‘X’ represents 1.1 parts per trillion of Halon in the air
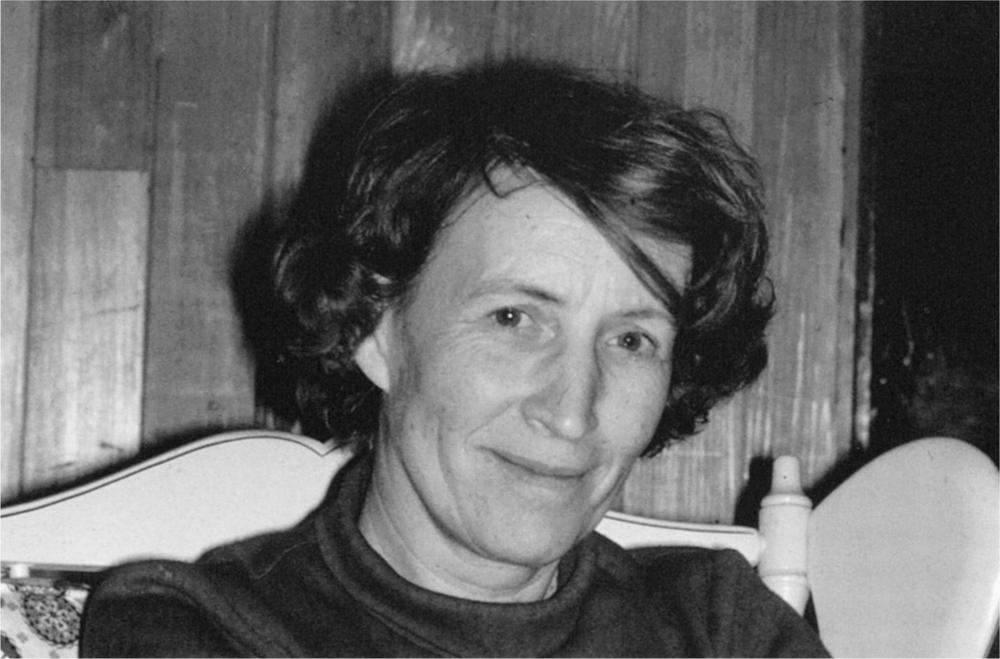
Plate 14.
Helen Lovelock at Bowerchalke, 1968
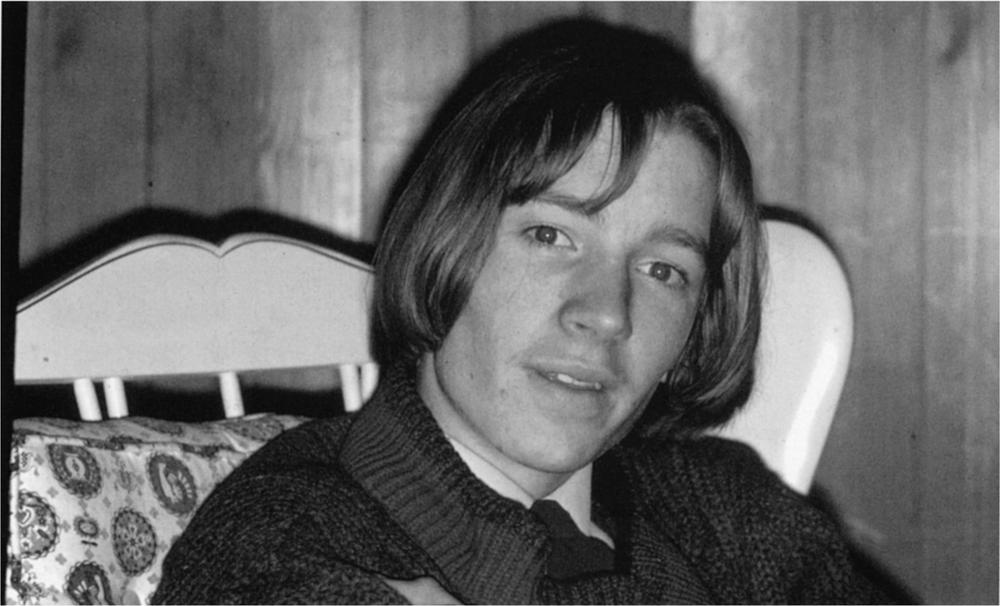
Plate 15.
Andrew Lovelock at Bowerchalke, 1968
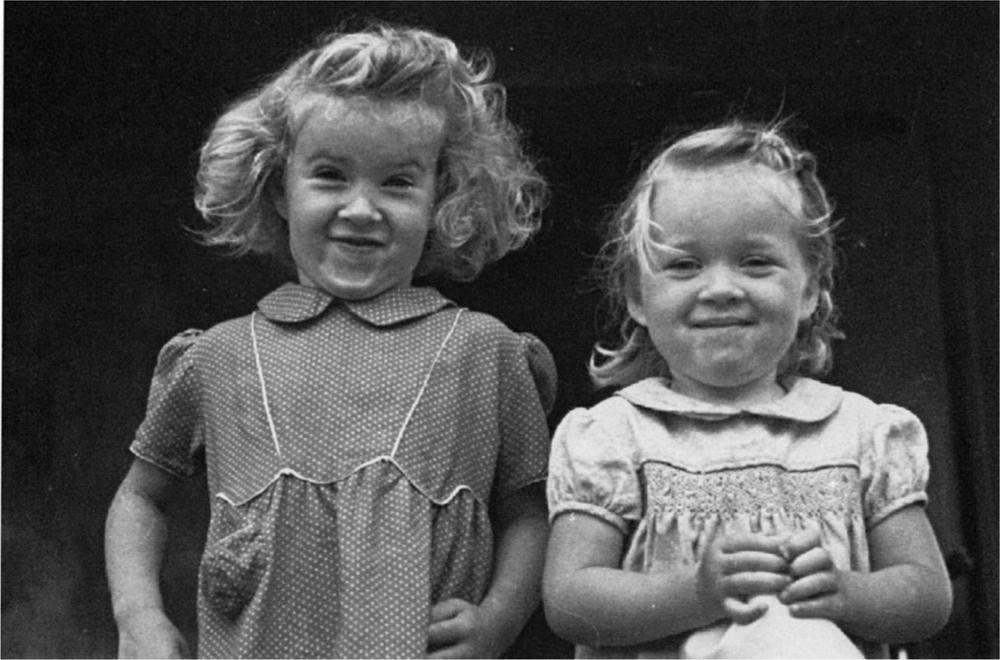
Plate 16.
Christine and Jane Lovelock at Harvard Hospital, 1947
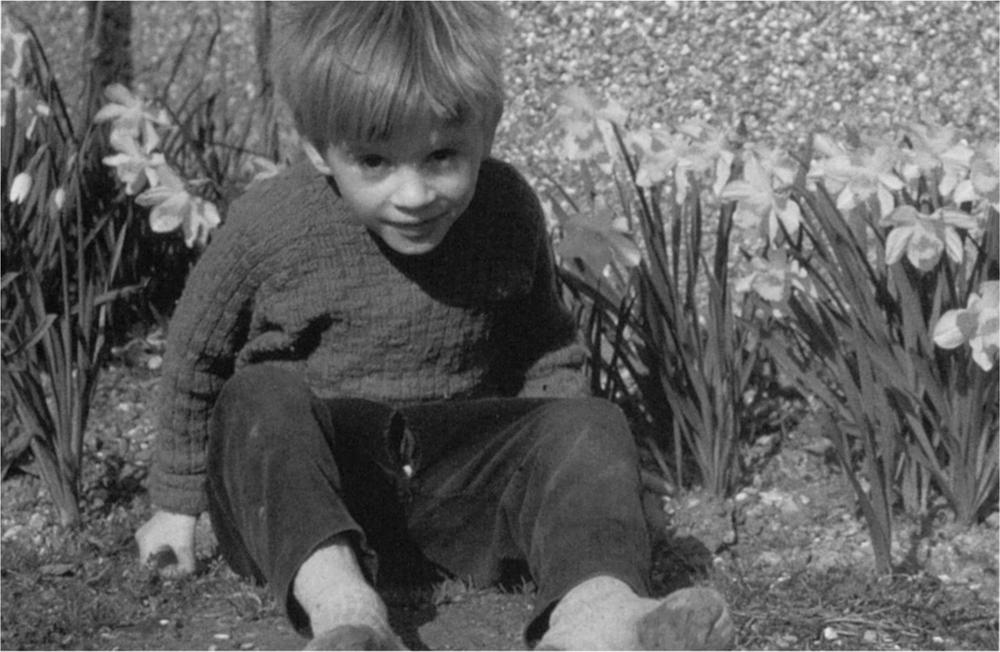
Plate 17.
John Lovelock at Bowerchalke, 1960
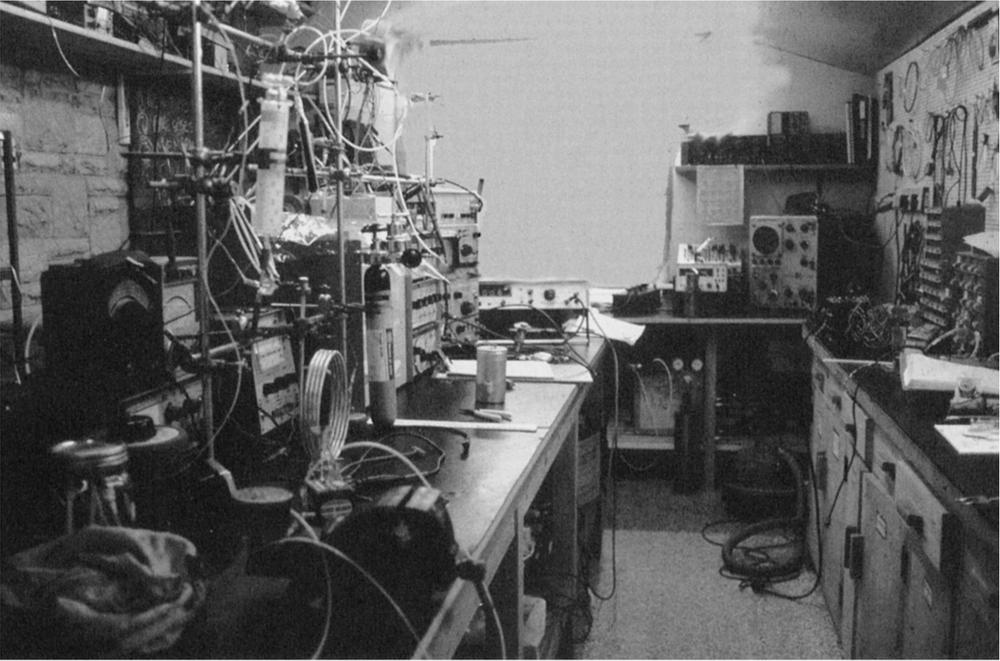
Plate 18.
The Bowerchalke laboratory, 1972
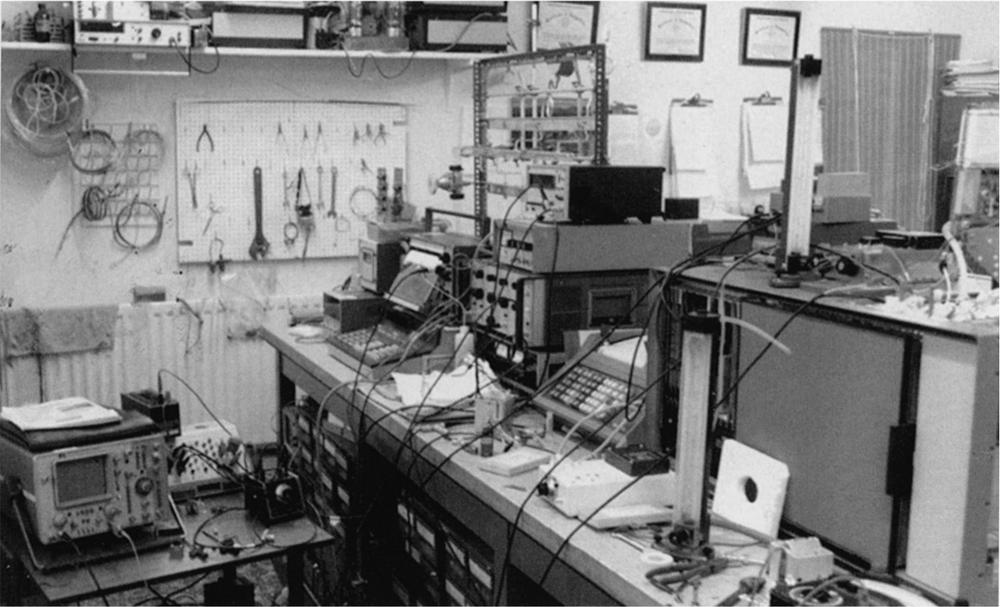
Plate 19.
The Coombe Mill laboratory, 1985
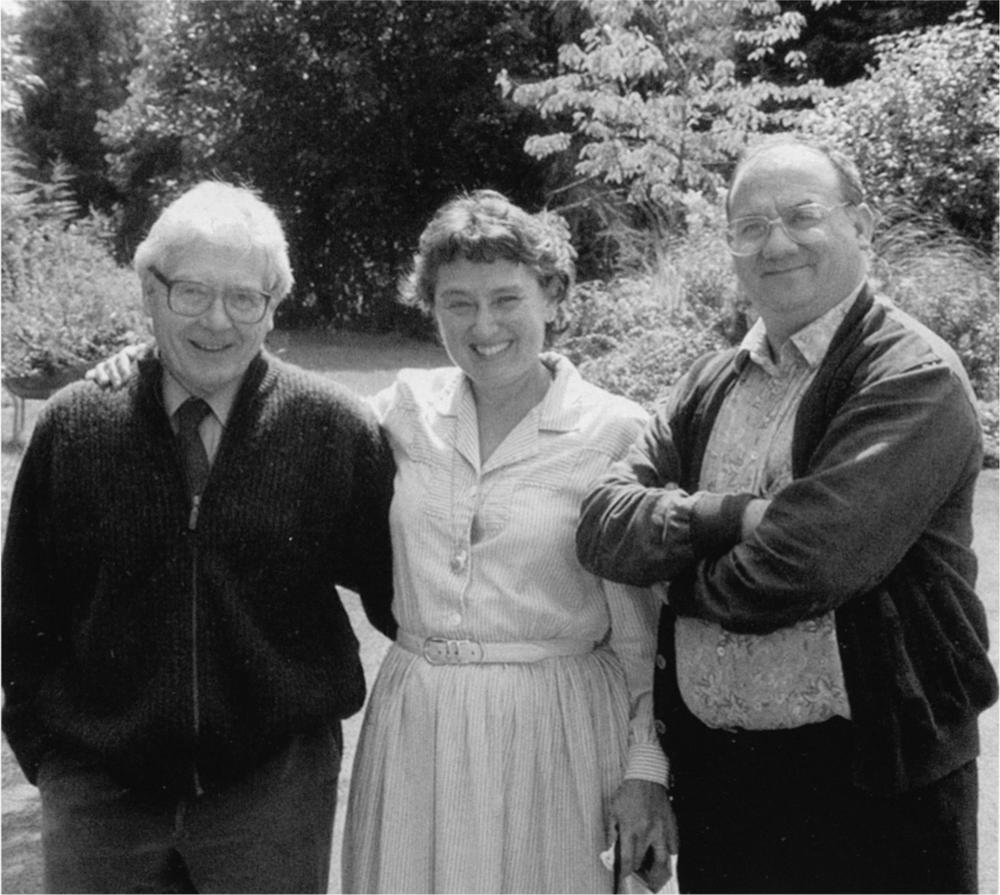
Plate 20.
Left to right
: James Lovelock, Lynn Margulis, and Ricardo Guerrero
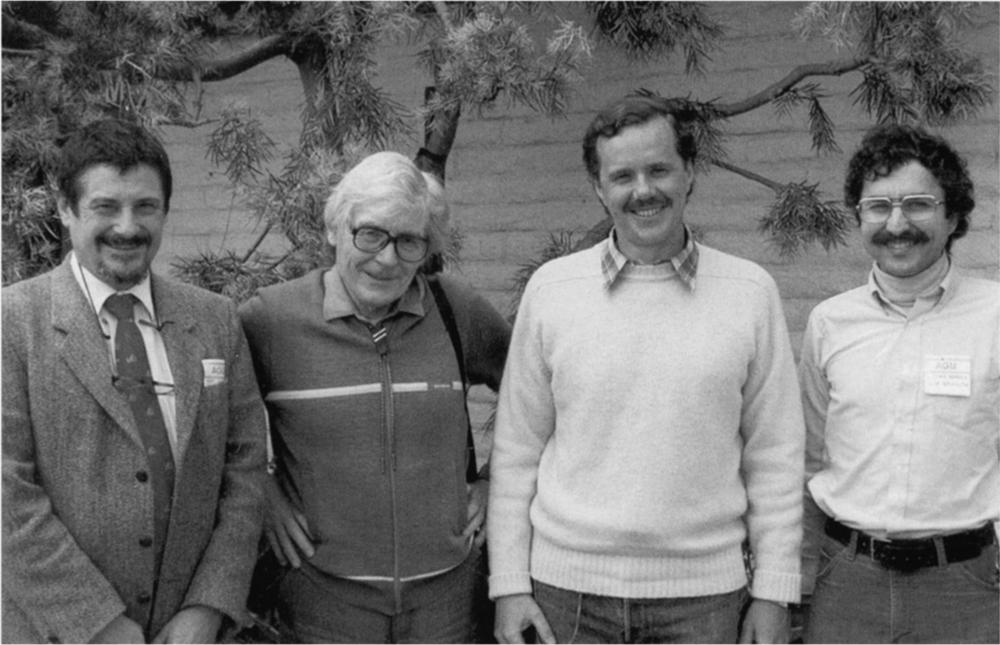
Plate 21.
Left to right
: Robert Charlson, Jim Lovelock, Andi Andreae, and Steven Warren
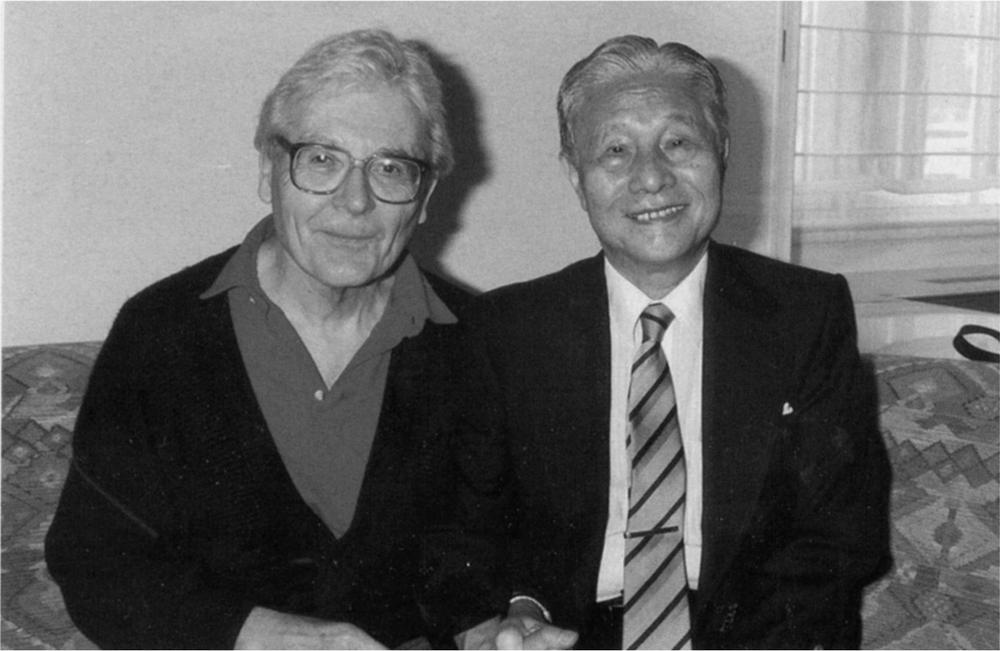
Plate 22.
James Lovelock and Hideo Itokawa
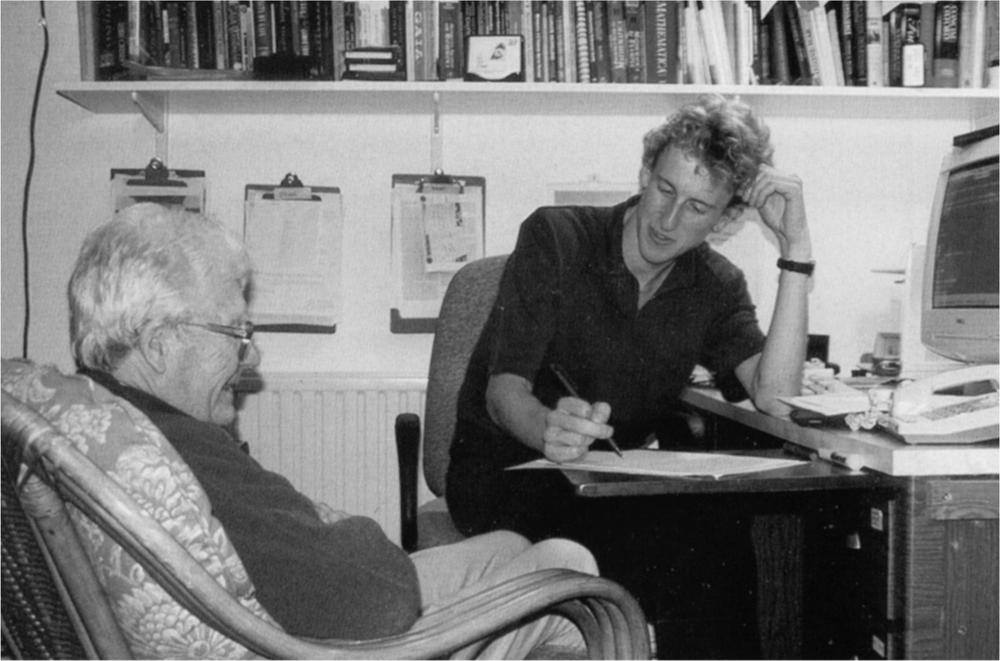
Plate 23.
James Lovelock and Tim Lenton
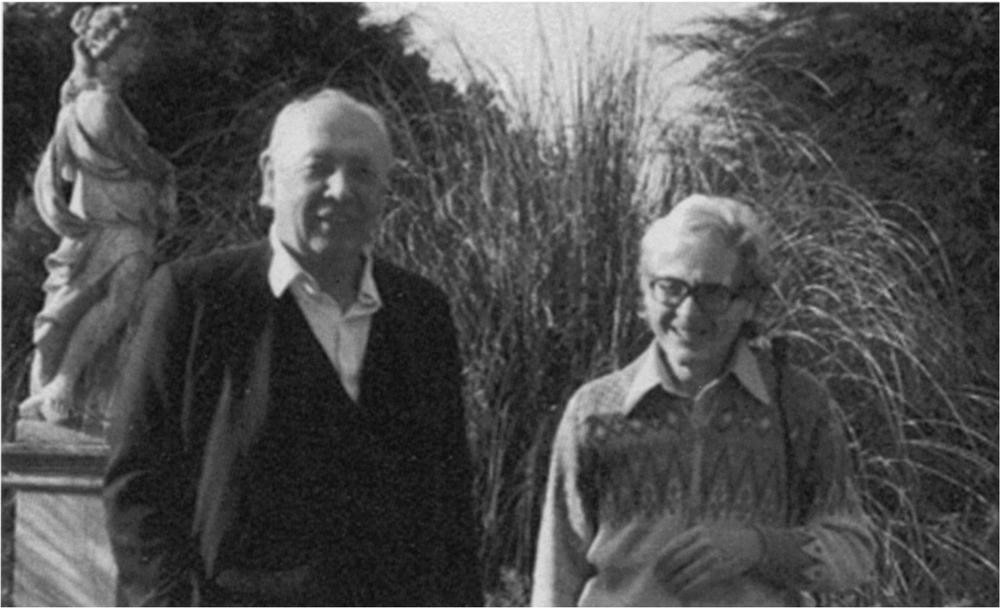
Plate
24.
Robert Garrels and James Lovelock at Coombe Mill
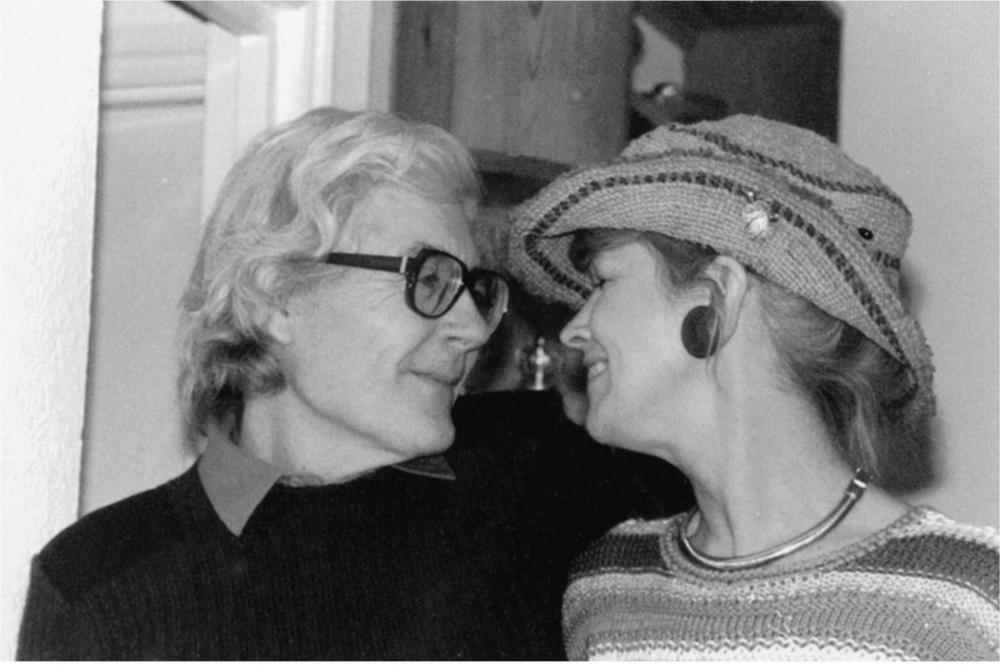
Plate 25.
Jim and Sandy at Portland Road, 1988
