Grid of the Gods (7 page)
Authors: Joseph P. Farrell,Scott D. de Hart

Within 15 minutes after the test radiation levels began climbing on Eneu Island, site of the test control bunker, which was supposed to be upwind from the test and thus immune to fallout. An hour after the shot the level had reached 40 (Rads per hour), and personnel had to retreat from the control room to the most heavily shielded room of the bunker until they could be rescued 11 hours later.
An hour after the shot Navy ships 30 miles south of Bikini found themselves being dusted with fallout with deck radiation levels rising to 5 (Rads per hour). Navy personnel were forced to retreat below decks and the ships retreated farther from the atoll.
As the fallout drifted east U.S. evacuation efforts lagged behind the plume. At Rongerik, 133 (nautical miles) from ground zero, 28 U.S. personnel manning a weather station were evacuated on 2 March but not before receiving significant exposures. Evacuations of the 154 Marshallese Islanders only 100 (Nautical miles) from the shot did not begin until the morning of 3 March. Radiation safety personnel computed that the islanders received a whole-body radiation dose of 175 rad on Rongelap, 69 rad on Ailininae, and 14 rad on Utirik.
26
But that was not the end of the fallout — pun intended — from the event.
The Japanese fishing vessel Daigo Fukuryu (Fifth Lucky Dragon) was also heavily contaminated, with the 23 crewmen receiving exposures of 300 R, one of whom later died — apparently from
complications. This incident created an international uproar, and a diplomatic crisis with Japan.
27
One cannot blame the Japanese government for being more than a little angry, because the “Castle Bravo” shot meant, in effect, that it was the
third
time America had nuked Japan, and this time, the two countries were not even at war and the victims were innocent fishermen trying to make a living!
After the dramatic and completely unexpected yield of “Castle Bravo,” a yield at the minimum almost double of what was expected, the United States abandoned its fire control bunkers on Bikini atoll, opting in the future for distant remote control firing, and the exclusion zones around test areas was increased to 570,00 square
miles
, or a circle
850 miles
across!
28

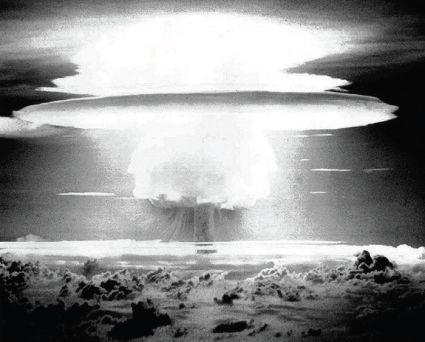
The Castle Bravo Test From About Fifty Miles Away, approximately two and a half minutes after the explosion.
The fireball of the “Castle Bravo” test “expanded to nearly four miles in diameter. It engulfed its 7,500 foot diagnostic pipe array all the way out to the earth-banked instrument bunker, which barely survived. It trapped people in experiment bunkers well outside the expected limits of its effects and menaced task force ships far out at sea.”
29
To put it mildly, the “Shrimp” bomb was a runaway monster, and left the physicists and engineers dumbfounded, even as they were staring at their visible bones in their hands, even through their tightly-shut and goggled eyes.
While the U.S. military were scrambling to rescue the islanders and service personnel endangered by the test shot, a red-faced State Department was trying to explain the “curious results” to the angry governments of the region, not the least of which was Japan. How could such a drastic miscalculation have happened? What had gone wrong, or from the weapons designers’ point of view, what had gone so incredibly
right?
The crisis had barely abated, when on March 27, 1954, the United States once again rolled the thermonuclear dice in the “Castle Romeo” test, and once again achieved some rather unexpected results. Its original predicted yield, prior to the spectacular “Bravo” success (or, depending on how one wants to view it, failure), was for a yield of 4 megatons, with outside limits being 1.5 to 7 megatons.
30
In the wake of the “Bravo” test, however, scientists quickly revised their yield predictions, and now calculated a yield of between 1.5 to 15 megatons with the likely yield being 8 megatons!
31
When fired, the “Castle Romeo” device, a bomb codenamed “Runt I” once again “ran away,” yielding an explosion of 11 megatons. Of course, this fell well within the
revised
predicted yield, but
only
because the predicted yield was of such a wide margin of error, as compared with the pre-”Bravo” yield of 4 megatons with outer limits of 1.5–7 megatons!
Once again, our little problem has returned, the problem that began with “Mike,” and continued with “Runt I”:
where was all this extra energy coming from?
1. An Interesting Story
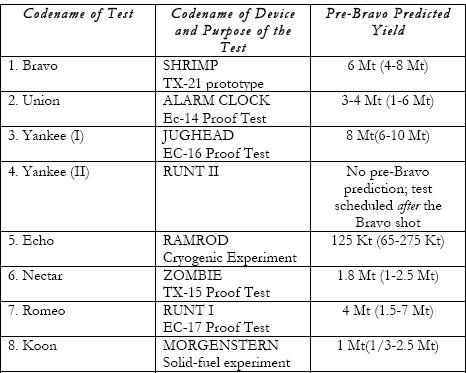
More light can be shed on that question by a glance at the tables for the pre- and post-Bravo predicted yields for the Castle series of nuclear tests, for these tables tell an interesting story.
The Castle series of tests was to have consisted of eight shots, designated Bravo, Union, Yankee, Echo, Nectar, Romeo, and Koon, respectively. The following table gives the names of the tests, the name of the device tested, and the pre-Bravo predicted yields expected for each:
Table of Pre-Bravo Predicted Yields for the Castle Series of Nuclear Tests
32

But in the wake of the “Bravo” success as a firing, and its failure as an international incident, the figures for all remaining tests were re-
calculated, and an explanation for its run-away success was found, but in that explanation, a new, and terrible, mystery surfaces, as we shall see.
2. The Standard Explanation for “Castle Bravo” and “Castle Romeo”
It will be recalled from our previous description of the “Bravo” test’s “Shrimp” device that approximately 60 percent of the lithium mixture of the lithium deuteride was ordinary, stable, everyday common lithium-7. And therein lay the explanation (at least, as far as we have been told):
The room-temperature Shrimp device used lithium enriched to 40 percent lithium 6; it weighed a relatively portable 23,500 pounds and had been designed to fit the bomb bay of a B-47 when it was weaponized. It was expected to yield about five megatons, but the group at Los Alamos that had measured lithium fusion cross sections had used a technique that missed an important fusion reaction in lithium 7, the other 60 percent of the Shrimp lithium fuel component. “They really didn’t know,” Harold Agnew explains, “that with lithium 7 there was an n, 2n reaction (i.e., one neutron entering a lithium nucleus knocked two neutrons out). They missed it entirely. That is why Shrimp went like gangbusters.” Bravo exploded with a yield of fifteen megatons, the largest-yield thermonuclear device the US ever tested.
33
Woops.
Certainly the lithium-7 reactions
do
explain
most
of the reason why such an inordinately high yield was achieved, and do so within acceptable margins of error.
Or do they?
Let us do a bit of detective work concerning this lithium-7 explanation. We first observe that the explanation of the extra energy achieved for those tests on the basis of the fusion of ordinary lithium-7 might be true in the cases of those tests, except for one important problem: the
original
H-bomb test, “Mike,” was
not
fueled by lithium reactions at all, but solely by the fusion of
deuterium
reactions along with the fission reactions in the primary and
secondary.
Nowhere
in standard thermonuclear reactions is there a reaction that forms lithium-7 from various reactions of deuterium, either with itself or with other products within its family of reactions!
34
So where did
“Mike’s”
extra energy come from?
We are told that the lithium-7 reaction accounted for this extra “boost” in the reaction yield, but as we have already seen, in the overwhelming case of lithium-7 reactions, the resulting products will allow only one component, tritium, to continue fusion reactions, and those reactions form a comparatively
small
percentage of normal fusion reactions.
To put it bluntly, and succinctly, though it would appear that while the lithium-7 explanation accounts for
most
of the extra yield of these two devices, it is unlikely that it accounts for
all
of it. Why are we reasonably confident of this? Because, once again, the original hydrogen bomb, “Mike,” contained no lithium-6
or
lithium-7, and yet it too “ran away”! Its reactions would have been confined to reactions
not
involving lithium-7, and
these would have had to have burned very efficiently to achieve its actual yield.
Some
other
energy source might therefore also have been in play in
all
these devices.
But if so, what was it?
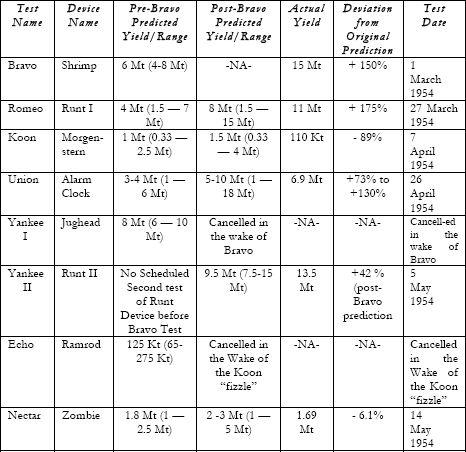
A final and extremely important clue is afforded by careful study of the following table:
Table of Post-Bravo Predicted Yields, Actual Yields, and Deviations from Original Predictions for the Castle Series of Nuclear Tests
35

Note first of all the Castle Bravo, Romeo, and Union tests. In each of these cases, the deviation from the original predicted yields
at the minimum
exceeds 73 percent and goes as high as a 175 percent deviation!
But note also the significance of the “Castle Koon” test, the test of a device designed by Lawrence Livermore Laboratories under the
direct supervision of Dr. Edward Teller.
36
Its revised yield was a comfortable 1.5 megatons,
but instead, the device “fizzled” and failed to achieve barely any fusion reactions at all, coming in at a mere 110 kilotons.
We are told that of the fizzled yield, only 10 kilotons was accounted for by fusion reactions, or about 9 percent of the total yield. The other 91 percent of the yield was obtained from the fission reactions of the primary and secondary. The explanation for this “fizzle” (which nonetheless managed to carve out a crater 990 feet wide and 75 feet deep!) was “an unexpectedly long time delay between the primary firing and the secondary ignition. Reportedly this was due to a simple design flaw — the neutron flux from the primary had preheated the secondary leading to poor compression.”
37
Of course, in the thermonuclear kettle of these witches’ brews, the slightest change of just a few nano-millimeters of the thickness of any solid state item within the device, the slightest change of positioning of various components,
can —
within the split-seconds’ timing of the various stages of the reaction — alter its efficiency significantly, and either enhance, or impede, the overall reaction yield. So from one point of view, this explanation has merit.
