Bailout Nation (15 page)
Authors: Barry Ritholtz

The “buy the dip” strategy had been a successful moneymaker throughout most of the 1990s. That was good for another bounce back to 4,200 by summer's end. But the market couldn't hold on to its gains. Valuations remained too high, and earnings were falling off a cliff.
By September, stocks were back in sell-off mode again. The NASDAQ finished 2000 near 2,400; it was a brutal way to end the year.
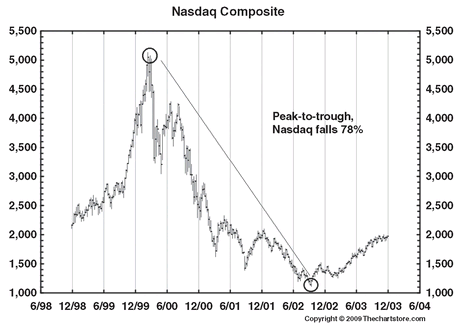
For the calendar year 2000, the NASDAQ lost 39 percent. From its peak, it was down more than 50 percent. By October 2002, the NASDAQ Composite had traded down to 1,100, shedding 78 percent of its total value (see
Figure 7.4
). It was the biggest U.S. stock disaster since the 1929 Crash.
Figure 7.4
). It was the biggest U.S. stock disaster since the 1929 Crash.
About now, you might be wondering why a book on bailouts has spilled so much ink on the U.S. stock markets. There is a good reason, in fact two good reasons why.
Figure 7.4
NASDAQ, 1999-2002
NASDAQ, 1999-2002

The first is asset prices. The Greenspan Fed had made repeated forays toward protecting asset prices from significant losses. Whether the motivation was to maintain confidence or to protect the economy is not relevantâthe end results were the same. The central bankers created enormous moral hazard that resulted in ever more reckless speculation.
Second, and more important, each subsequent attempt into managing the (kinda) free markets required ever greater intervention. The capital markets are enormous, unruly beasts consisting of hundreds of trillions of dollars in value, traded by millions of people every day. They cannot be tamed or managed for very long. No, not even by a master “market whisperer” like Greenspan.
As we will soon see, the collapse of NASDAQ equities prodded the Federal Reserve into action. Greenspan began an unprecedented mop-up operation after the bubble popped. He would soon learn that the cleanup was even more expensive than anyone had imagined.
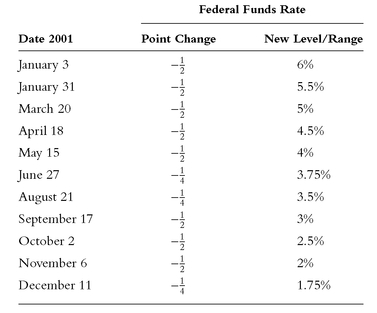
In January 2001, the Federal Reserve started an extraordinary rate-cutting process, one for which there is no comparison. On January 3, the Fed made an intermeeting cut of a half point, which was followed by another half-point cut on January 31, and then more half-point cuts on March 20, April 18, and May 15. June and August each saw quarter-point cuts. By the end of the summer, rates had been nearly halved, down to 3.5 percent (see
Table 7.1
).
Table 7.1
).
All this rate slashing was before September 11. A recession had begun much earlier in the year, with the National Bureau of Economic Research dating its start as of March 2001. It would end shortly after 9/11, in November of that year.
Table 7.1
2001 Rate Cuts
2001 Rate Cuts

There are those who have claimed that this radical rate cutting was in response to 9/11. Others have suggested that the terrorist attacks were what caused the recession. This historical revisionism is factually incorrect. As the record plainly shows, the recession had begun one year after the market peaked, and half a year prior to the terror attacks.
On September 10, 2001, the NASDAQ was at 1,700. If you for a moment ever doubted that Greenspan specifically targeted the stock market and not the economy, consider his actions after the 9/11 al-Qaeda attack. That Tuesday saw the nation in shock. By the terrorists' design, the entire event played out live on television. That day, the Fed did
. . .
nothing, except for releasing a two-sentence statement: “The Federal Reserve System is open and operating. The discount window is available to meet liquidity needs.”
. . .
nothing, except for releasing a two-sentence statement: “The Federal Reserve System is open and operating. The discount window is available to meet liquidity needs.”
My firm's office was headquartered on the 29th floor of 2 World Trade (I was in the Long Island office that day), so I admittedly have little in the way of objectivity about what happened on September 11. But I vividly recall wondering when the Fed was going to do something. The attacks kept markets closed for the rest of the weekâthe first time the NYSE had been closed since the Kennedy assassination and funeral.
With the World Trade Center smoldering in ruins, the Fed sat around and waited. Wednesday, Thursday, Fridayânothing. It wasn't until right before the markets reopenedâwhen it would matter most to asset pricesâthat it finally did something. On September 17, 2001, almost one week after the attack, and precisely one hour before markets reopened, the Fed slashed rates another half point.
Whatever doubts there were that Greenspan was supporting asset prices disappeared forever that morning.
When the markets finally reopened, selling pressure was immediate. Prior to the attacks, the NASDAQ had already suffered losses of 66 percent. That week, it would lose another 17 percent. From that deeply oversold condition, a 50 percent snapback rally would have the index kissing 2,100 by January 2002. The gains were merely technical, a reaction to the massively oversold condition the postattack trading created. The downtrend soon reasserted itself.
By the summer of 2002, the post-9/11 lows of 1,400 were reached, then breached. The NASDAQ would trade down to 1,300 in July, then 1,200. By October, it would reach its ultimate bottom at 1,100.
The total NASDAQ fall from its peak was 78 percent, with losses measured in the trillions of dollars.
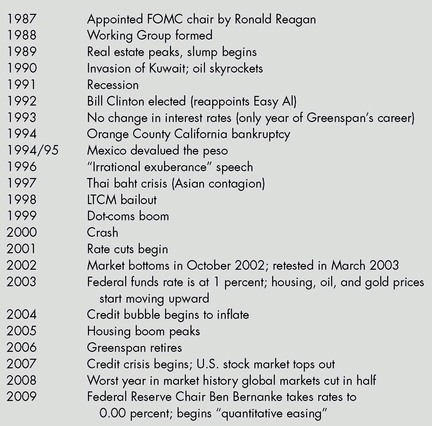
Greenspan Time Line

It was in this environment that the Fed continued the most significant rate-cutting cycle in its history. From the precrash high of 6.5 percent, the Fed gradually took rates lower and lower still.
By the end of 2001, the federal funds rate was at 1.75 percentâa level not seen since John F. Kennedy was president in 1962. During previous recessions in 1954, 1958, and 1960, rates had been below 2 percentâbut only for a few weeks or months at a time. Incredibly, the Greenspan Fed maintained a 1.75 percent cap on the fed funds rate from December 2001 to September 2004. That was a total of 33 months at these ultralow levels. To people who have made a career out of watching the Fed, this was inconceivable.
And it was not quite done yet. A cut in November 2002 took rates down to 1.25 percent; they were kept there for 21 months (November 2002 to August 2004). The coup de grace was one last 25 basis point cut to a 1 percent fed funds rate in June 2003. Incredibly, the Fed left the rate this low for over 12 months, (June 2003 to June 2004). While the fed funds rate had been as low as 1 percent some 46 years earlier, it had never been allowed to stay that low for more than a year!
At this point, it's worth asking why the Fed took rates to such ridiculous extremes. The 2001 recession was fairly mild. The consumer barely paused spending. It was primarily a business capital expenditure (capex) recession. Even that was largely a one-off Y2K-related issue. And the September 11 tragedy, while horrific in its human toll, had only a minor impact on the U.S. economy.
The only plausible explanation for the radical rate cuts was asset prices. Greenspan was hell-bent on bailing out stock investors.
It is the very first rule of economics:
There is no free lunch
. If you drop rates down to ultralow levels, there will be significant repercussions. There was a reason these actions had never been done before by any prior Fed chief. There are costs associated with supposedly free money. Rates this low were incredibly inflationary. More than a few economists warned that this would lead to a massive surge in dollar devaluation, inflation, even speculation and other unintended consequences.
Someone at the Fed should have listened to them.
Chapter 8
The Backwards, Rate-Driven Economy
There are some frauds so well conducted that it would be stupidity not to be deceived by them.
âCharles Caleb Colton (
Lacon
, 1825)
Lacon
, 1825)
Â
Â
I
n the mid-2000s, news of the housing boom and bust was omnipresent. There was no one in the United States unaware of the huge run-up in home prices during 2002-2006, or of the subsequent bust that followed.
n the mid-2000s, news of the housing boom and bust was omnipresent. There was no one in the United States unaware of the huge run-up in home prices during 2002-2006, or of the subsequent bust that followed.
What most people did not realize, however, was just how disproportionate the role the so-called real estate-industrial complex played during the 2002-2007 economic cycle. Few investors at the time were aware of the impact the housing boom hadânot just for the real estate market, but for the stock market as well. Even today, most people do not really comprehend the full impact the real estate market had on the rest of the economy.
In order to understand how the United States ended up a Bailout Nation, it is crucial to put the extraordinary surge of housing into broader context.
In most business cycles, it is the economy that drives real estate. Job creation and wage growth are the key drivers of home purchases. Buyers save for a down payment, get approved for a mortgage, and then go shopping to buy a home. While interest rates are an important factor, in the typical cycle it's the economy that matters most.
But that's not how it happened this time.
The 2002-2007 housing cycle was historically unique. The combination of ultralow rates, new types of exotic mortgages, changes in lending standards, and massive securitization created the perfect storm for a housing boom. Consider for a moment a normal economy, with robust job creation and healthy wage gains. Under those circumstances, high-risk subprime loans and innovative mortgages would have been totally unnecessary. Without the very low rates or the new exotic debt instruments, the biggest growth in housing since World War II would not have occurred. It was that dangerous combinationâand not job or income gainsâthat led to the unprecedented U.S. housing boom.

L
et's go back to the end of the last recession: The nation had suffered through a wrenching three-year stock market crash (2000 to 2003). NASDAQ, where the hottest stocks had been listed, plummeted 78 percent from peak to trough. The losses were nearly identical to those of the 1929 crash and subsequent bear market. After the crash came the 2001 recession. Companies cut back their hiring and spending. It was unusual for a recession that consumers barely paused (consumer spending accounts for nearly 70 percent of the U.S. economy). The official National Bureau of Economic Research (NBER) dates for the economic contraction were March to November 2001âwhen 9/11 and its economic aftershocks hit, the recession was actually near its end.
et's go back to the end of the last recession: The nation had suffered through a wrenching three-year stock market crash (2000 to 2003). NASDAQ, where the hottest stocks had been listed, plummeted 78 percent from peak to trough. The losses were nearly identical to those of the 1929 crash and subsequent bear market. After the crash came the 2001 recession. Companies cut back their hiring and spending. It was unusual for a recession that consumers barely paused (consumer spending accounts for nearly 70 percent of the U.S. economy). The official National Bureau of Economic Research (NBER) dates for the economic contraction were March to November 2001âwhen 9/11 and its economic aftershocks hit, the recession was actually near its end.
Other books
The Mysterious Cases of Mr. Pin by Mary Elise Monsell
Captain and a Corset by Wine, Mary
Deep Space Endeavor 3 Death Match by Ron Francis
Her Two Dads by Ariel Tachna
The Chieftain's Feud by Frances Housden
The Coat Route by Meg Lukens Noonan
Ghost of a Promise by Moran, Kelly
Cupid Has a Heart-On (The Holidays #2) by Tara Sivec
Hate at First Sight by Nixon, Diana
Blood Pact (McGarvey) by Hagberg, David
