Attract Visitors to Your Site: The Mini Missing Manual (6 page)
Read Attract Visitors to Your Site: The Mini Missing Manual Online
Authors: Matthew MacDonald

Using this system, Google Analytics collects two kinds of
information:
- Information about your visitors’ browsers and computers.
Whenever a browser requests a page, it supplies a basic set of information. This information includes the type of browser it is, the features it supports, and the IP address of the computer it connects through. These details don’t include the information you really want—for example, there’s no way to find out personal details like names or addresses. However, Google uses other browser information to infer additional details. For example, using the IP address, it can make an educated guess about your visitor’s geographic location. - Visitor tracking.
Thanks to its sophisticated tracking system, Google Analytics can determine more interesting information about a visitor’s patterns. Ordinarily, if a visitor requests two separate web pages from the same site, there’s no way to establish whether those requests came from the same person. However, Google uses a
cookie
(a small packet of data stored on a visitor’s computer) to uniquely identify each visitor. As a result, when visitors click links and move from page to page, Google can determine their navigation path, the amount of time they spend on each page, and whether they return later.
Google Analytics wouldn’t be nearly as useful if it were up to you to make sense of all this information. But as you’ll see, Google not only tracks these details, it provides reports that help you figure out what the data really means. You generate the reports using a handy web screen menu, and you can print them out or download the data and use it in another program, like Excel, to do further analysis.
Signing Up for Google Analytics
Signing up for Google Analytics is easy:
1.
Head over to
http://www.google.com/analytics/
and click the Sign Up Now link.
Google Analytics is one of many services you can access with a single Google account. That means you can use the same account you use for services like Gmail (Google’s Web-based mail service), Google Groups, Google AdSense, and Blogger. If you don’t have a Google account, you’ll be prompted to create one by providing your email address and password.
2.
Fill in the information about your website.
Here’s the information you need to supply:
The URL for the website you want track (for example,
http://www.supermagicalpotatoes.co.uk/
). A Google Analytics account can track as many websites as you like, but for now start with just one.
Your time zone. This lets Google Analytics synchronize its clock with yours.
3.
Click Finish.
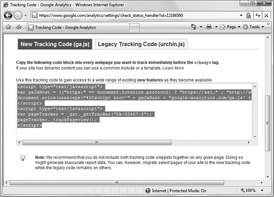
When you finish the sign-in process, Google gives you a box with the JavaScript code you need to start tracking visits (see
Figure 1-11
). The next section tells you how to add that code to your pages.
4.
Click Finish to complete the process.
Google sends you to the main management page for Google Analytics.
5.
Add the tracking code to your web pages.
When you add Google’s script code to a page, put it at the very end of the section, just before the closing tag. Here’s an example of where it fits in a typical web page:
"http://www.w3.org/TR/xhtml1/DTD/xhtml1-strict.dtd">
...
Tip: For best results, copy the tracking code to every Web page in your site. The only exception is for frames-based sites. If you have one, don’t copy the tracking code to the pages used for navigation bars, headers, and other non-content regions. There’s generally no point in recording requests for these elements, because your site displays them automatically.
6.
Upload the new version of your web pages.
Once you change all your pages, make sure to upload them to your web server. Only then can Google Analytics start tracking visits. The tracking features won’t work when you run the pages from your own computer’s hard drive.
Now, it’s a waiting game. Within 24 hours, Google Analytics has enough information about recent visitors to provide its detailed reports.
Examining Your Web Traffic
As a registered Google Analytics user, you can log in to read reports and make sure everything’s running smoothly. If you haven’t already done so, now’s the time to head to
http://www.google.com/analytics/
.
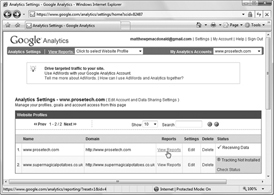
When you first log in, you see the Analytics Settings page shown in
Figure 1-12
. Using this page, you can add new websites you want to track or configure existing ones. You can also get a little guidance from a list of help topics that appears on the side.
To determine whether your website’s tracking code is working, check the Status column in the Website Profiles list. Here’s how to interpret the different status values your site might have:
- Receiving Data indicates that all’s well. Your visitors are going from page to page under the watchful eye of Google Analytics.
- Waiting For Data indicates that Google’s JavaScript code is running on your pages, but the information isn’t available for reporting yet. Usually, you see this for the first 6 to 12 hours after you register a new site.
- Tracking Data Not Installed indicates that Google isn’t collecting any information. This could be because you need to wait for visitors to hit your site, or it could suggest you haven’t inserted the correct JavaScript tracking code.
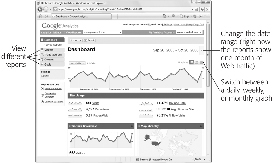
If you see Receiving Data, congratulations—you’re reports are ready and waiting. Click the View Reports link next to your website to continue on to the Dashboard (
Figure 1-13
).
The information that appears in the Dashboard can be a little overwhelming. To give you a better sense of what’s going on, the following sections break down the key points, one chart at a time.
Graph of Visits
The graph of visits at the top of the page (
Figure 1-14
) shows the day-by-day popularity of your site over the last month. This count doesn’t say anything about how many pages the average visitor browsed, or how long visitors lingered. It simply records how many different people visited your site. Using this chart, you can get a quick sense of the overall uptrend or downtrend of your web traffic, and you can see if it rises on certain days of the week or around specific dates.
With a few clicks, you can change this chart to show
pageviews
, the count of how many web pages all your visitors viewed. For example, if an eager shopper visits your Banana Painting e-commerce store, checks out several enticing products, and completes a purchase, Google Analytics might record close to a dozen pageviews but only a single visit. The number of pageviews is always equal to or greater than the number of visits—after all, each visit includes at least one pageview. To see pageviews, click the down arrow next to the word “Visits” in the top-left corner of the chart, and then choose Pageviews from the list of options.
Tip: Remember, you can look at the data Google Analytics collects over a different range of dates using the date box in the top-left corner of the Dashboard, as identified in
Figure 1-13
.
Site Usage
The Site Usage section (
Figure 1-15
) is crammed with key statistics. Details include:
- The total number of visits in the selected date range (initially, it’s the month leading up to the current day).
- The total number of pageviews.
- The average number of pages that a visitor reads before leaving your site.
- The bounce rate. A
bounce
occurs when a visitor views only one page—in other words, they get to your site through a specific page, and then depart without browsing any further. A bounce rate of 11% tells you that 11% percent of your visitors leave immediately after they arrive. Bounces are keenly important to webmasters because they indicate potential lost visitors. If you can identify what’s causing a big bounce, you can capture a few more visitors. - The average time a visitor spends on your site before browsing elsewhere.
- The percentage of new visits. For example, a rate of 75% indicates that 25% of your traffic is repeat business, and 75% are new visitors. Both types of visitor are important to keep your website healthy.


