Ancient DNA: Methods and Protocols (40 page)
Read Ancient DNA: Methods and Protocols Online
Authors: Beth Shapiro

23 Analysis of High-Throughput Ancient DNA Sequencing Data 209
propagated into alignment and data analysis. Alternatively, read trimming can be combined with alignment, for example by
allowing the alignment of the 3 ¢ end to be extended either into the genome or the adapter. For short adapter pieces, the adapter and the reference may provide equally good alignment scores. In these cases, the alignment should be terminated and a trimmed alignment reported.
Since the example data set is paired-end, we will use the
MergeReadsFastQ_cc program; for single read data, KeyAdapter TrimFastQ_cc is available. Any adapter chimeras that have been identifi
ed (see Subheading 3.2 ) can be pr
ovided to either program to be fi ltered from the output fi les.
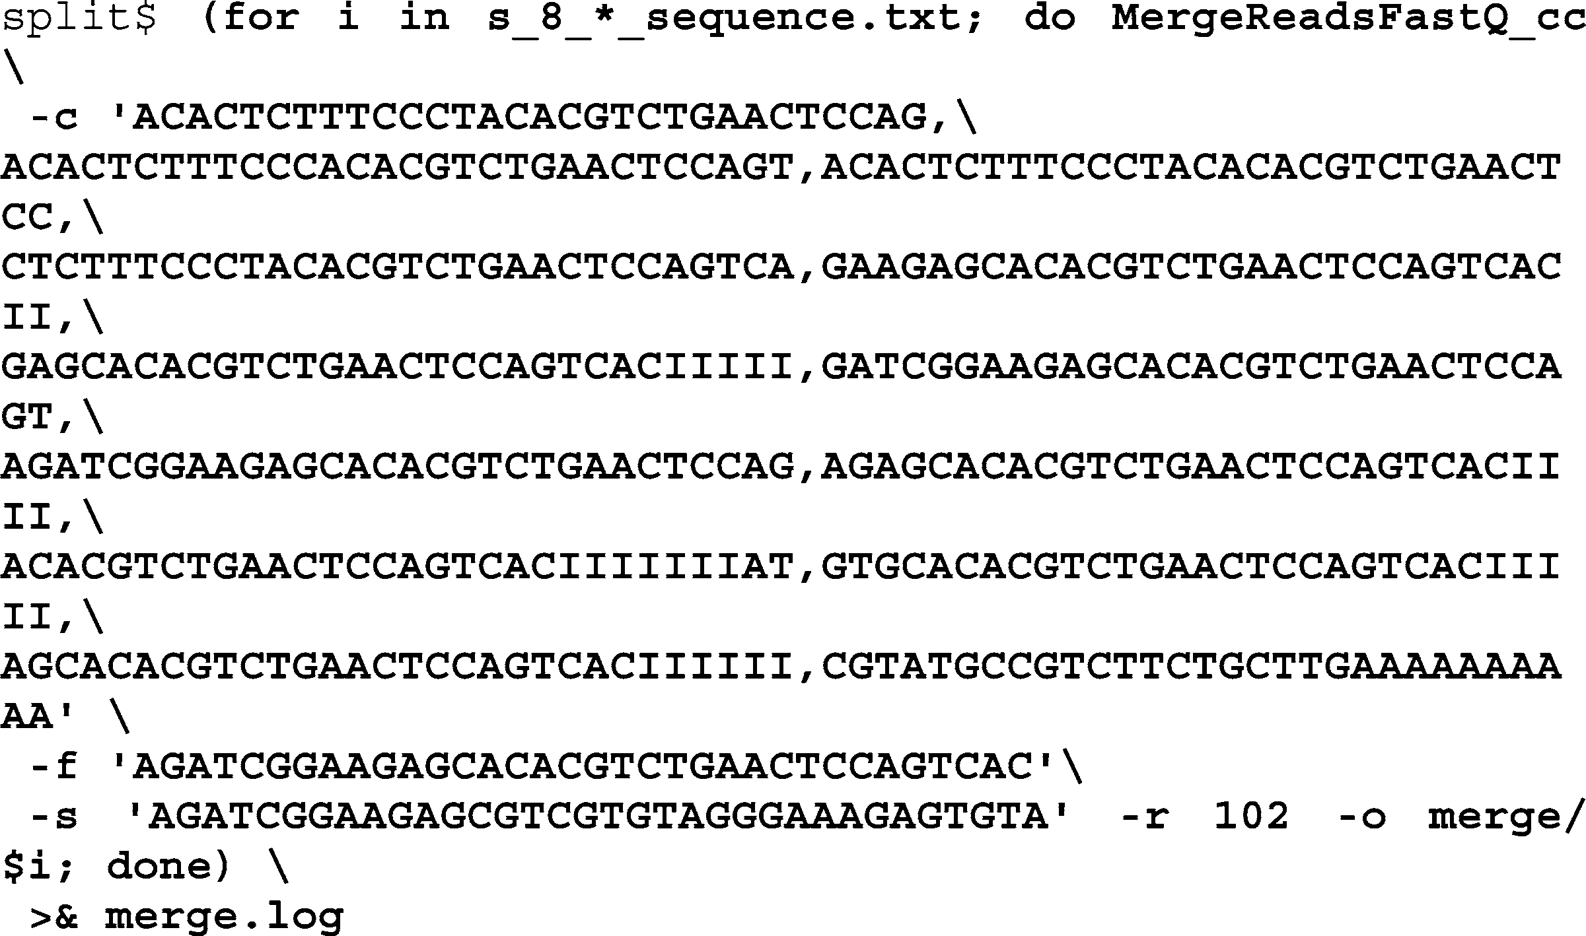
Applying this to the example data set, fi rst create a new subfolder
merge
:
Then call MergeReadsFastQ_cc in a for-loop for each of the fi les obtained fr
om the demultiplex step (see Subheading 3.1
). The c parameter defi nes a comma separated list of artifact sequences
(obtained in Subheading 3.2 ),
f
defi nes the adapter starting at the end of the forward read and
s
the adapter starting at the end of the second read. Parameter
r
defi nes the start position of the second read in the provided sequence fi le,
o
the output folder, and
$i
is the iterator variable of the for-loop. Redirect the command line output to a log fi le called
merge.log
:
210
M. Kircher
The merging script above will separate the two paired-end
reads in the output fi le if merging is not successful. Merged reads can be identifi ed in the output fi le by an “M_” at the beginning of the read identifi er, while “F_”/“R_” indicate the forward and reverse read, respectively. The number of adapter dimers removed and the number of merged/non-merged reads are printed to command line when the script fi nishes. For the example data set, the fraction of removed adapter dimers/chimeras is on average 0.22%
(minimum 0.00%; maximum 2.24%). If average numbers above
3–5% are observed, optimization of the library preparation protocol should be considered to improve future sequencing experiments. In the resulting fi les, 85.0% of reads are merged (minimum 61.8%; maximum 95.4%), which is typical for short insert sizes. By contrast, the φ X174 control library, which has a considerably higher average insert size of ~350 nt, shows only 1.7% merged reads.
The length distribution of the merged reads provides an
approximation of the length distribution of molecules in the aDNA library. We can obtain this distribution by extracting from the FastQ
fi les all reads where the identifi er starts with an “M_” and determining their length. The length counts can be plotted using the statistical programming language R
( 50
) . Figur
e 5
shows the fi rst nine plots. The following command lines were used to generate them.
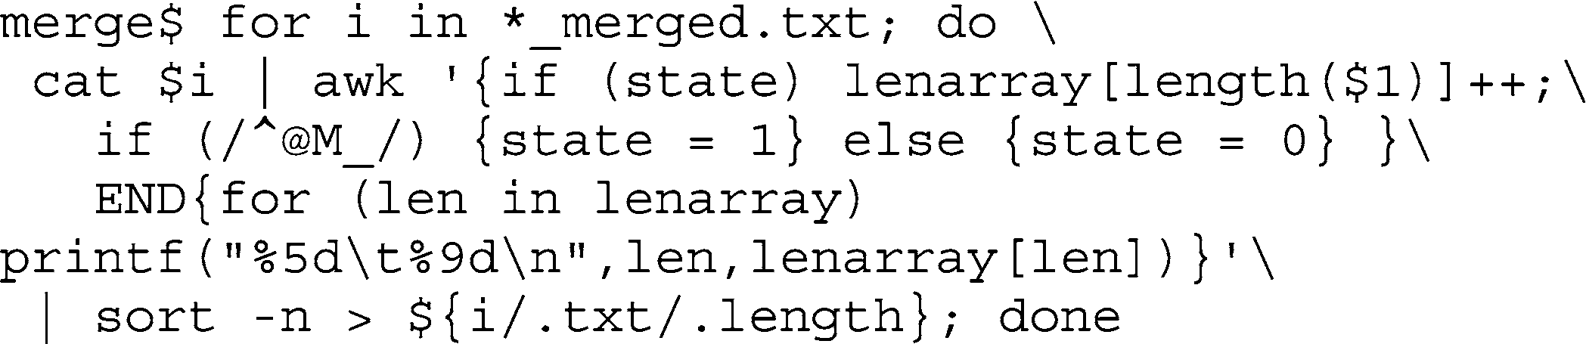
In a for-loop, iterate over all merged fi les. Use the command line tool awk to count the different sequence lengths observed for reads with read identifi ers starting with “M_”. Sort the output by number and write it to one fi le per sample. The output fi les have the extension “.length” instead of the extension “.txt” used for the FastQ fi les:
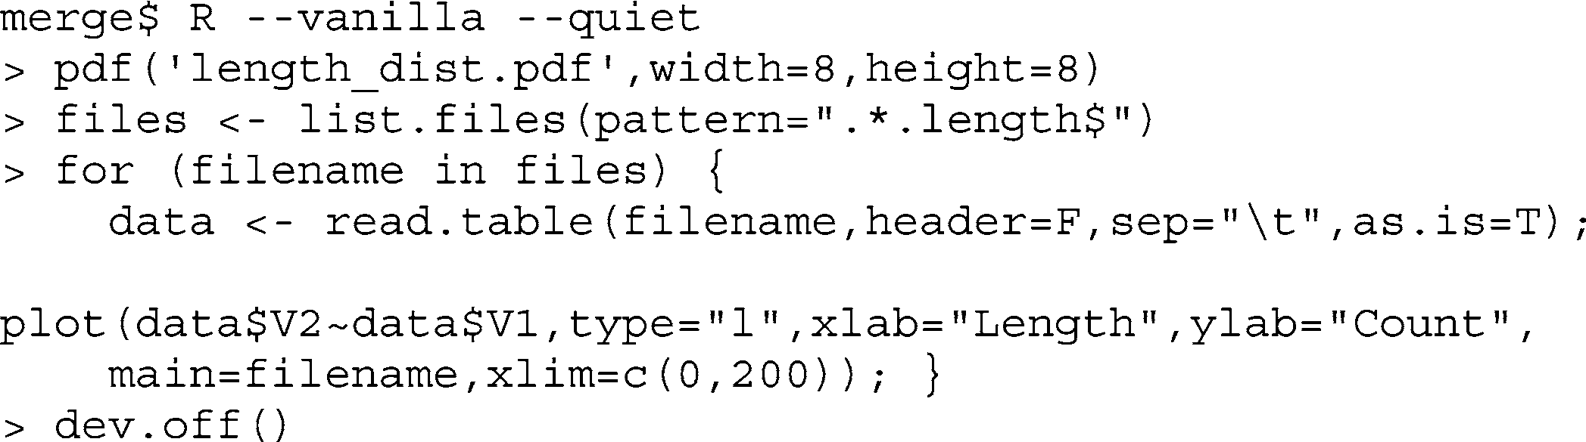
Open the statistical pr
ogramming language R ( 50 )
, generate an output PDF
length_dist.pdf
, obtain a list of all
.length
in the current folder, iterate over these fi les, and plot them into the PDF:
23 Analysis of High-Throughput Ancient DNA Sequencing Data 211
s_8_che:ar1_sequence_merged.length
s_8_che:ar2_sequence_merged.length
s_8_che:arc_sequence_merged.length
5000
6000
4000
3000
3000
Count
Count
Count
2000
1000
1000
0
0
0
0
50
100
150
200
0
50
100
150
200
0
50
100
150
200
Length
Length
Length
s_8_che:euo_sequence_merged.length
s_8_che:gal_sequence_merged.length
s_8_che:meg_sequence_merged.length
12000
3000
8000
10000
2000
Count
Count
Count
0005
1000
0
0 4000
0
0
50
100
150
200
0
50
100
150
200
0
50
100
150
200
Length
Length
Length
s_8_che:mes_sequence_merged.length
s_8_che:mic_sequence_merged.length
s_8_che:mrz_sequence_merged.length
5000
6000
3000
4000
3000
Count
Count
Count
0002
1000
1000
0
0
0
0
50
100
150
200
0
50
100
150
200
0
50
100
150
200
Length
Length
Length
Fig. 5. Length distribution extracted from merged reads from 9 of the 96 samples. While some samples show very narrow length distributions (e.g., che:ar2, che:euo), others have wide distributions (e.g., che:arc, che:mrz, che:mic). The last plot (che:mrz) shows a higher number of sequences exactly at read length. This typically results from simple repeat sequences being merged incorrectly.
3.4. Quality Control
Most HTS technologies immobilize the sequencing template
and Filtering
using a random dispersal process. This results in different inter-sequence distances (either on a fl at solid phase fl ow cell or in the form of beads carrying multiple templates) and will cause different susceptibility to mixed-signal readouts. In the most extreme cases, these mixed signals may result in nearly random sequences with overall low base quality scores, or a sequence that is very similar to one of the original molecules but that contains low base quality scores or high error rates for some positions along the read. This distance effect on signal purity causes sequencing errors to be nonrandomly distributed among reads. Typically, instrument-specifi c preprocessing of the raw data removes these sequences (see Note 8). However, a simple quality-score-based fi lter, which is by design highly correlated with signal purity, can be applied to
212
M. Kircher
all bases of the read to assure data quality independently of a specifi c preprocessing pipeline.
Many analysis programs that are able to read FastQ as input do not use the quality score information in the actual algorithm.
Quality scores on the PHRED scale range mostly from 10 to 40
(10–0.01% error probability, see ref.
( 51
) ) and error probabilities above 1% are typically too high to be ignored for statistical inferences from the data. While several alignment programs and most genotype callers use these quality scores in their score calculation, many sequence annotation, motif fi nding, RNA folding, and phylogenetic analysis programs do not. For these types of programs, reads may be fi ltered for appropriate quality, or bases of low quality may be masked, for example by replacing the low-quality base with an ambiguous (N) basecall.
Various tools are available to produce run quality statistics (e.g., TileQC
( 52 )
or FastQC
( 53
) ). In addition to these, quality score recalibration based on alignment can be used to compare and adjust quality scores from different sequencing runs and different technologies (but see Note 9). At present, the most widely used algorithm is part of the Genome Analysis Toolkit (GA
TK) ( 54 )
, and is used, for example, in the 1,000 Genomes project. Sequencing control libraries provides a means to calibrate quality scores between reactions and sequencing platforms. For our example data set, the Ibis base caller
( 32
) used the φ X174 control library reads to train its statistical models and to adjust the quality score estimates.
As a next step, we will assess the quality score and base distributions using FastQC. FastQC generates an HTML report for a FastQ
fi le. Prior to running FastQC for each sample separately, we will run the complete raw sequence data fi le (execute the command line
Individual samples may be assessed if
something unusual is observed in the full data fi le.
Figur
e 6
shows parts of the HTML report output by FastQC.
There are fi ve critical results as indicated by cross-symbols in the report: (1) In the per base quality score plot, a few cycles show reduced average quality scores, which is a reasonable result of quality score calibration. (2 + 3) Per base sequence and GC content plots show spikes around the index reads, indicating an unbalanced base composition of the indexes selected. (4) Per read GC content differs from the theoretical distribution, which can be caused when larger pieces of the adapters are included in the sequence reads or due to GC bias from the enrichment process. (5)
K
-mer analysis identifi es patterns of 5-mer overrepresentation. These patterns match simple repeat sequences (these are also observed in the TagDust output and likely an artifact of the enrichment process) and motifs from the adapter sequences, the latter indicating that some adapter sequence is included in the read. Hence, the FastQC
report for the whole run did not show any surprising results.
In downstream analyses, we will use programs that make limited use of the quality scores. The mapping program BWA
( 55
) , for